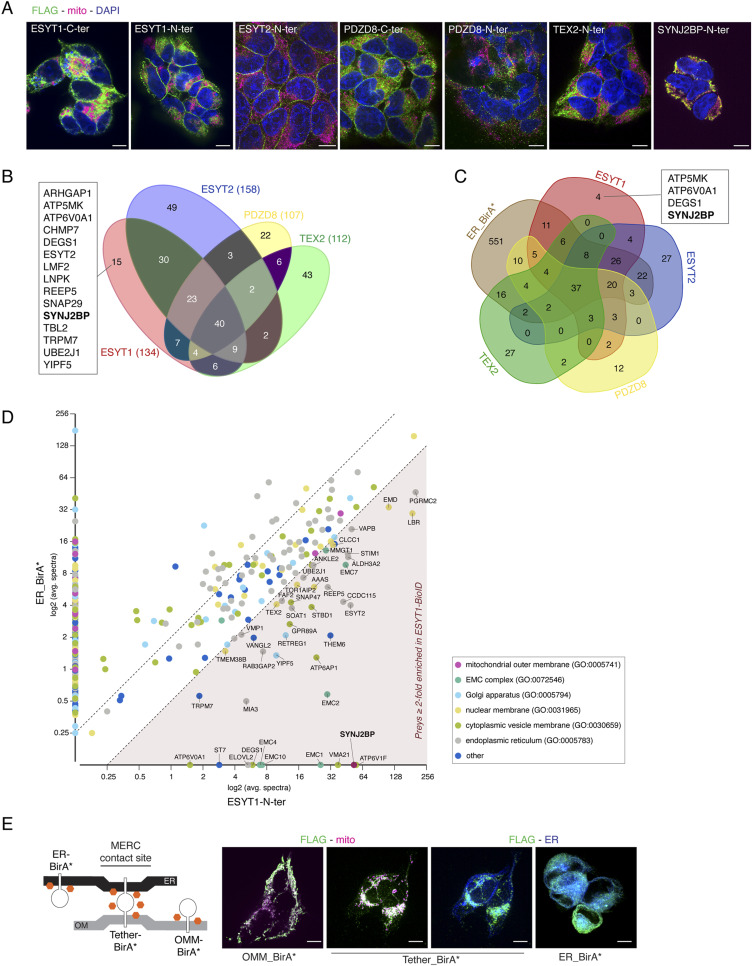
Figure S1. BioID analysis.
(A) Representative images of immunofluorescence analysis of individual baits. FLAG staining representing the bait is in green, mitochondrial marker TOMM20 in magenta, and DAPI in blue. Scale bar, 10 μm. (B) Venn diagram of the BioID results for all four SMP-domain proteins. Preys that were found as significant interactors of only ESYT1 are shown; SYNJ2BP is highlighted in bold. The numbers in parenthesis indicate a total number of identified preys for each bait with BFDR ≤ 0.01. (C) Venn diagram of the BioID results for all four SMP-domain proteins and the ER_BirA*. Preys (BFDR ≤ 0.01) that were found as significant proximity interactors of only ESYT1 are shown, SYNJ2BP is highlighted in bold. (D) Enrichment of proximity interactions of ESYT1 in comparison to the proximity interaction with ER_BirA*. Preys enriched in ESYT1 BioID (≥twofold) are indicated by their gene name. Cellular compartment GO term analysis of all preys was performed and is specified in the legend. Preys found on the x- or y-axis are only present in ESYT1 or ER BioID, respectively. (E) Schematic representation of ER-targeted BirA*, OMM-targeted BirA*, and artificial ER-OMM tether BirA* and representative images of immunofluorescence analysis of individual baits. FLAG staining representing the bait is in green, mitochondrial marker PRDX3 in magenta, and ER-mEmerald stain in blue. Tether_BirA* cells were stained with all three markers and the co-localization of the bait (in the same cell) with either the mitochondrial marker or the ER marker is shown. Scale bar, 10 μm.

