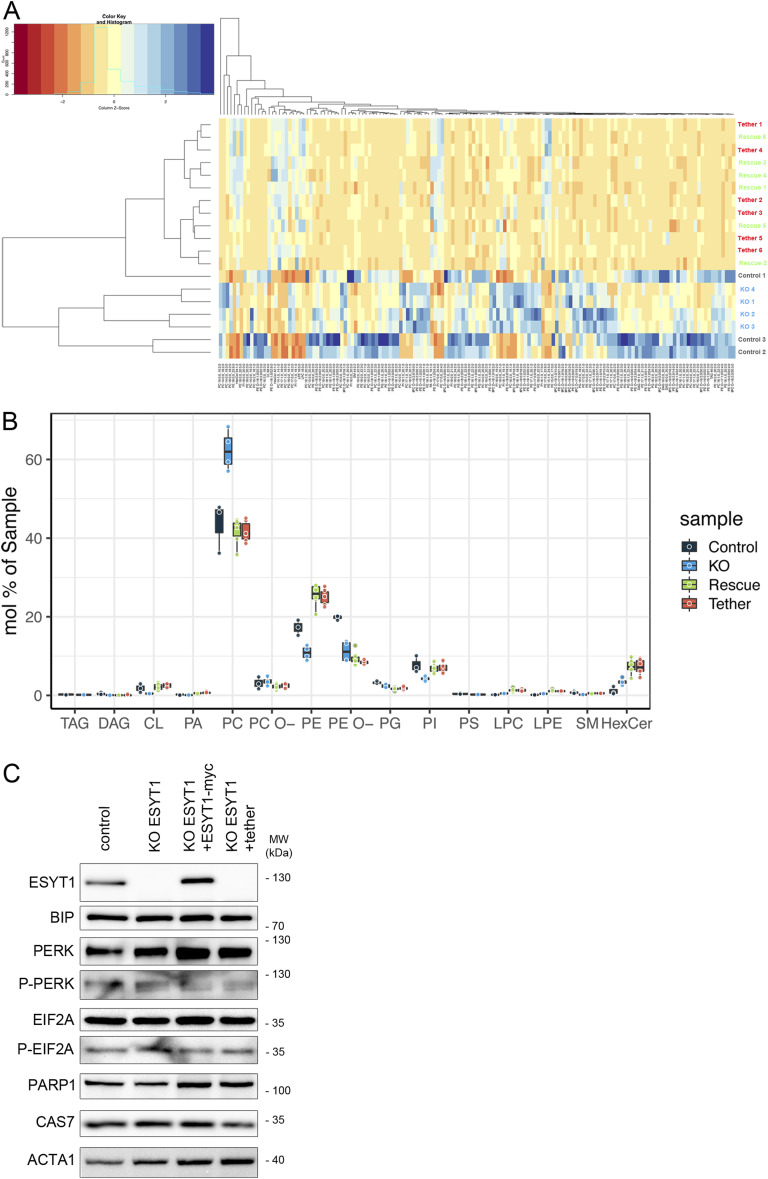
Figure S4. Mitochondrial lipids analysis.
Sucrose bilayer purified mitochondria from control human fibroblasts (control, n = 3), ESYT1 KO fibroblasts (KO, n = 4), and ESYT1 KO fibroblasts expressing either ESYT1–Myc (Rescue, n = 6) or an ER–mitochondria artificial tether (Tether, n = 6) were analyzed for absolute quantification of lipid content using shotgun mass spectrometry lipidomics. (A) Hierarchical clustering with heatmap analysis of samples (rows) and lipids (columns). (B) Lipid class profile of analyzed samples. Data are presented as molar % of the total lipid amount (mol%). TAG, triacylglycerol; DAG, diacylglycerol; CL, cardiolipin; PA, phosphatidate; PC, phosphatidylcholine; PC-O, phosphatidylcholine ether; PE, phosphatidylethanolamine; PE-O, phosphatidylethanolamine ether; PG, phosphatidylglycerol; PI, phosphatidylinositol; PS, phosphatidylserine; LPC, lyso-phosphatidylcholine; LPE, lyso-phosphatidylethanolamine; SM, sphingomyelin; HexCer, hexosylceramide. (C) WB analysis of ER stress and cell death pathway proteins in control fibroblasts, KO ESYT1 fibroblasts, KO ESYT1 fibroblasts overexpressing ESYT1–Myc or the artificial tether. Whole-cell lysates were analyzed by SDS–PAGE and immunoblotting. Actin was used as a loading control.

