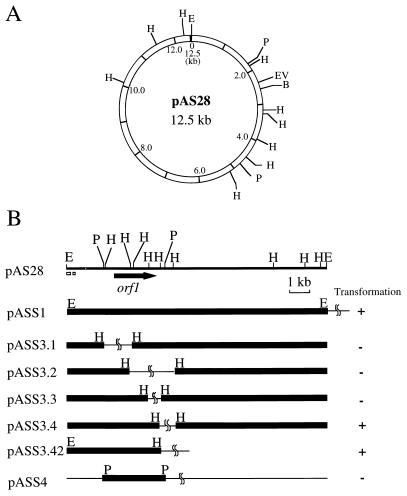
FIG. 3.
(A) Restriction map of pAS28. (B) Restriction map of pAS28 subclones. pAS28, pASS1, pASS3.1, pASS3.2, pASS3.3, pASS3.4, and pASS3.42 are shown as linearized at the unique EcoRI site. pASS4 is also shown as linearized at the EcoRI site in the pCRIIc sequence. The location and orientation of orf1 are indicated by the horizontal arrow below the restriction map of pAS28. The two small, open boxes below the restriction map of pAS28 show the locations of AT-rich regions. The abilities of recombinant plasmids to transform Alteromonas sp. strain A28 are indicated on the right. For pAS28 subclones, thin bars indicate pCRIIc DNA and thick bars represent DNA fragments subcloned from pAS28. Restriction sites: B, BglII; E, EcoRI; EV, EcoRV; H, HindIII; P, PvuII.

