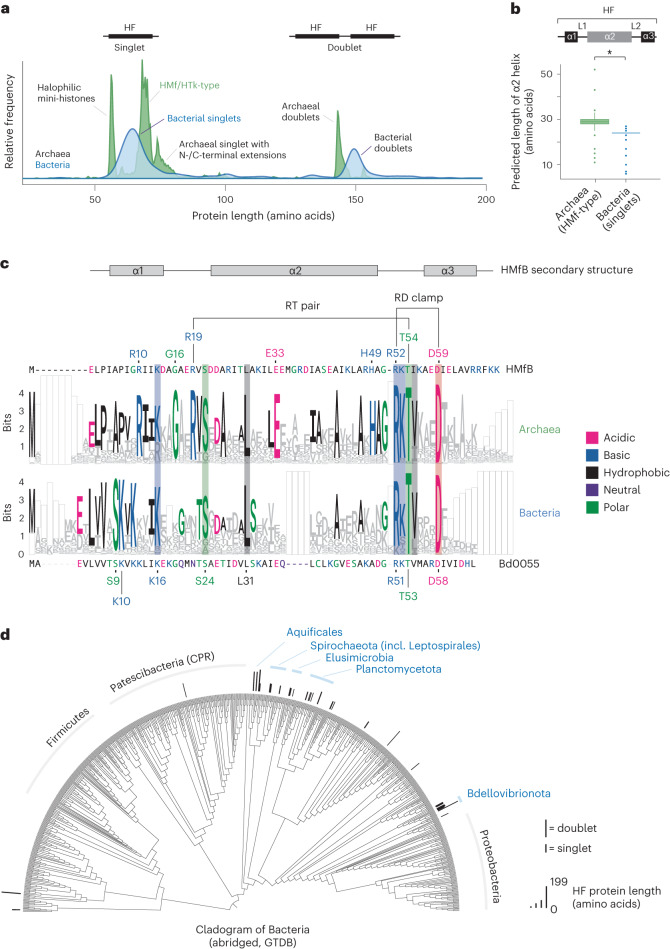
Fig. 1. Histone-fold proteins in bacteria.
a, Length distribution of proteins (<200 amino acids) encoding predicted histone-fold domains in bacteria and archaea. Relative frequencies are shown. b, Length of the α2 helix in bacterial versus HMf/HTk archaeal singlet histones (*, P = 3.24 × 10−185, two-sided Mood test, N = 1,278 archaeal histones, N = 180 bacterial histones; box plots show median and interquartile ranges (IQR), with whiskers extending to 1.5*IQR and values beyond this point plotted individually). c, WebLogo representation for bacterial versus archaeal singlet histones. Bacterial (bottom panel) and archaeal (top panel) histones were aligned separately, followed by profile–profile alignment to allow comparison across kingdoms. Alignment gaps were coded as a separate character to retain their information value and are visualized as empty boxes. Residues that are notably conserved across kingdoms are highlighted by shaded boxes. d, Abridged (see Methods) bacterial species tree illustrating the phyletic distribution of histone-fold-containing proteins across the kingdom. Histones are represented as bars, the length of which is scaled to capture relative protein length in amino acids. Shorter bars indicate singlets and longer bars represent doublets or, on occasion, proteins with additional domains (see Supplementary Table 1 for details).

