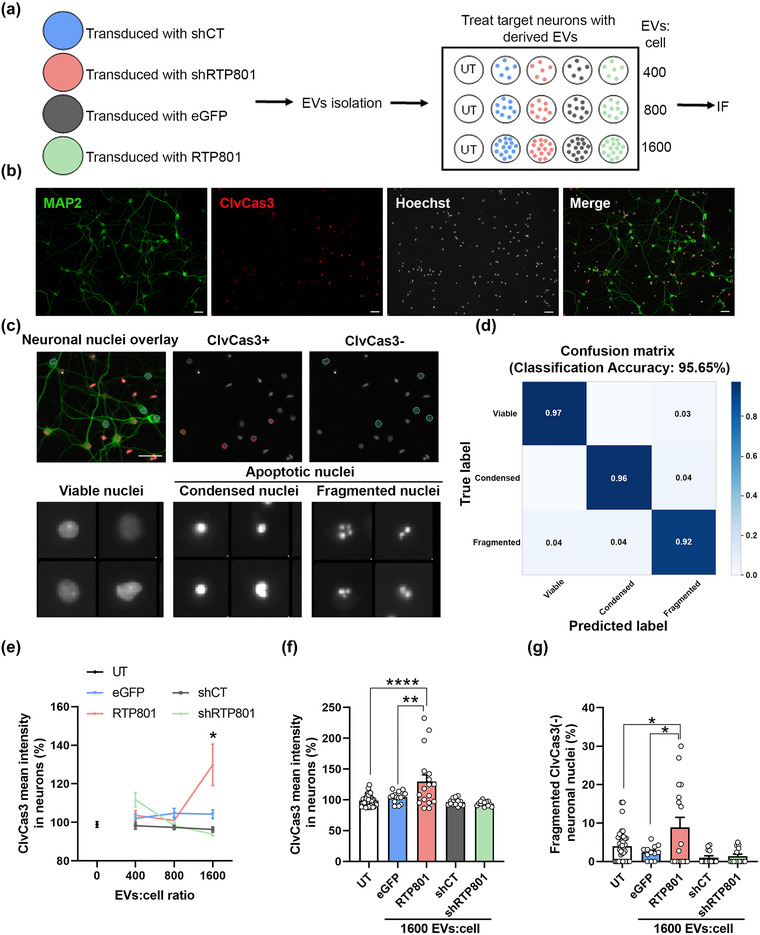
FIGURE 3.

EVs derived from RTP801 overexpressing neurons induce neuron cell death via apoptosis. (a) Schematic representation of the experimental procedure. Cultured cortical neurons were transduced with lentiviral particles containing eGFP, eGFP‐RTP801, shCT and shRTP801 constructs. EVs were isolated from the culture medium and used to treat sister cortical neurons at three different doses: 400, 800 and 1,600 EVs:cell. After 24 h, neurons were fixed, and immunofluorescence against active caspase‐3 was performed. (b) Representative images of neuronal cultures at DIV14. MAP2 (in green) is used to identify neurons and ClvCas3 (in red) to identify cells expressing cleaved caspase‐3. Scale bar of 50 µm. (c) Neuronal nuclei were classified by phenotype: ClvCas3(+) (red outline) represents neurons expressing ClvCas3 and ClvCas3(‐) (blue outline) represents neurons with no active caspase‐3. Scale bar of 50 μm. Neuronal nuclei were then classified by machine learning into viable or apoptotic. Apoptotic nuclei were subclassified as condensed and fragmented. (d) Confusion matrix obtained with the classification training with CellProfiler Analyst. (e) ClvCas3 mean intensity in neurons. Data of the 3 doses of EVs‐treatment. (f) Data of ClvCas3 mean intensity only at the highest EVs dose (1,600 EVs:cell). (g) Quantification of neurons undergoing the last step of the apoptotic process (Fragmented ClvCas(‐) neuronal nuclei). At least neurons of 5 different fields were analysed per replicate. Values represent culture replicates of at least three independent neuronal cultures (mean ± SEM). Data was analysed by One‐way ANOVA (*P < 0.05, **P < 0.01, ****P < 0.0001).
