
FIGURE 5.
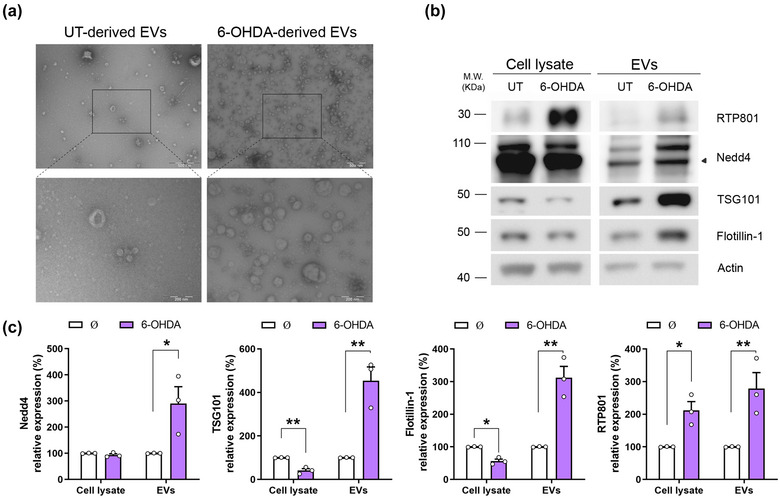
6‐OHDA exposure increases RTP801 protein levels in EVs and elevates their secretion in cortical primary cultures. (a) Rat cortical neurons at DIV14 were treated with the toxin 6‐OHDA 50 µM for 16 h or untreated (UT) as control. Afterward, cell media was collected, and EVs were isolated by sequential centrifugations. EVs suspension was negatively stained and observed by TEM. Electron micrographs show the presence of vesicles between 30 and 110 nm. Scale bars are 500 nm and 200 nm in magnification micrographs (b) Sister cultures were treated with 6‐OHDA 50 μM for 16 h or not (∅) and total protein content was analysed by WB. Membranes were probed against RTP801 and NEDD4, TSG101, and Flotillin‐1 as EVs markers and actin as a loading control. Graphs show values obtained by densitometric analysis of WB data relative to the total protein content of the cell lysate. Values represent culture replicates of at least three independent neuronal cultures (mean ± SEM). Representative immunoblots are shown. Data were analysed by Student's T‐test in the cell lysate and the EVs fraction (*P < 0.05, **P < 0.01).