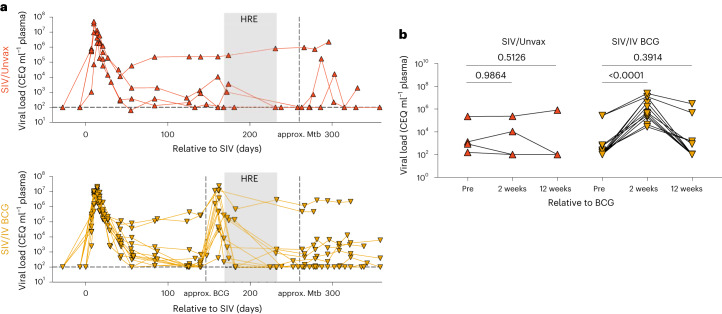
Fig. 1. Plasma viraemia of SIV+ unvaccinated and vaccinated animals.
Plasma viral copy equivalents were determined by qRT–PCR. Each point indicates an individual animal (SIV/Unvax, n = 4; SIV/IV BCG, n = 12). a, Plasma viral load (in copy equivalents (CEQ) ml−1) of SIV+ unvaccinated (top, red up-pointing triangles) and SIV+ vaccinated (bottom, gold down-pointing triangles) animals over the course of the study. Horizontal dashed line represents the limit of detection. b, Plasma viral load of each group before (pre), 2 weeks and 12 weeks, relative to BCG vaccination. Time-matched plasma from SIV+ unvaccinated animals served as a control. Repeated measure one-way ANOVAs were performed on each group (SIV/Unvax, P = 0.5759; SIV/IV BCG, P < 0.0001). Multiple comparisons relative to ‘pre-BCG’ were performed using Dunnett’s multiple comparisons tests. Adjusted P values for multiple comparisons are shown.

