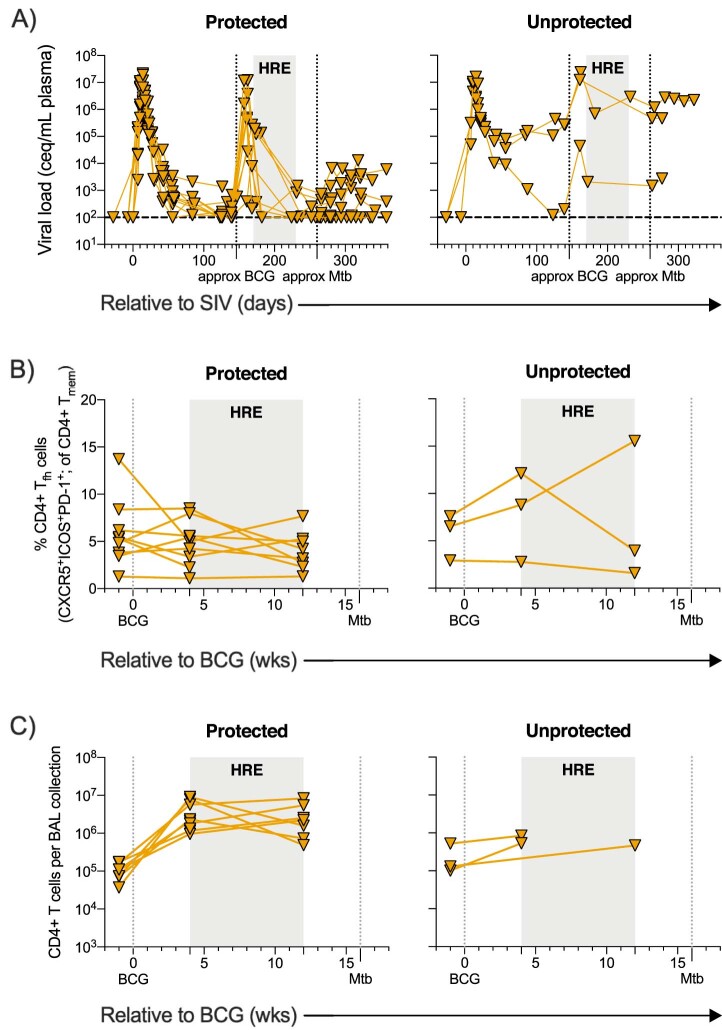
Extended Data Fig. 6. Plasma viral load, PBMC CD4+ Tfh T cells, and BAL CD4 + T cell levels stratified by protection across SIV+ vaccinated animals.
Individual symbols and lines indicate protected animals (thoracic CFU < 100, n = 9) and unprotected animals (thoracic CFU > 100, n = 3). a) Plasma viremia in protected and unprotected SIV+, vaccinated animals over the course of the study. b) Frequency of CD4+ Tfh T cells (CXCR5+ICOS+PD-1+) in PBMC from protected and unprotected SIV+, vaccinated animals relative to BCG vaccination. c) Number of CD4 + T cells per BAL collection in protected and unprotected SIV+, vaccinated animals relative to BCG vaccination.

