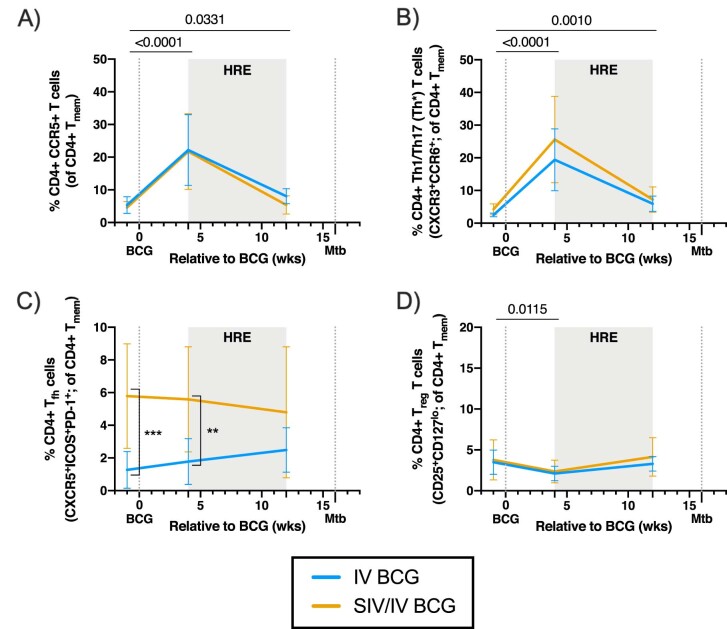
Extended Data Fig. 3. CD4 + T cell phenotype in PBMC after vaccination.
a) Frequency of CD4 + CCR5 + T cells in PBMC relative to BCG vaccination. b) Frequency of CD4 + Th1/Th17 (Th*) T cells (CXCR3+CCR6+) in PBMC relative to BCG vaccination. c) Frequency of CD4+ Tfh T cells (CXCR5+ICOS+PD-1+) in PBMC relative to BCG vaccination. d) Frequency of CD4+ Treg T cells (CD25+CD127lo) in PBMC relative to BCG vaccination. a-d) Lines indicate mean and error bars indicate SD of SIV-naïve (light blue) and SIV+ (gold) vaccinated animals. SIV-naïve vaccinated animals: pre-BCG (n = 7), 4 wks post BCG (n = 7), and 12 wks post BCG (n = 7). SIV+ vaccinated animals: pre-BCG (n = 12), 4 wks post BCG (n = 12), and 12 wks post BCG (n = 11). Individual animal data are shown in Supplementary Data 8. Linear mixed effects models with subject as a random variable were used. Fixed effect tests were used to assess mean differences among time points and vaccine groups. Time points were compared to ‘pre-BCG’ control using Dunnett’s multiple comparison tests. Significant p-values (p < 0.05) across time are shown above each graph. Significant differences determined by Mann-Whitney tests between vaccination groups at given time points are indicated by brackets and significant p-values indicated: **p < 0.01 and ***p < 0.001. Fixed effect test results, Dunnett’s multiple comparisons, and Mann-Whitney test results are reported in Supplementary Table 2C. All statistical tests were two-sided.

