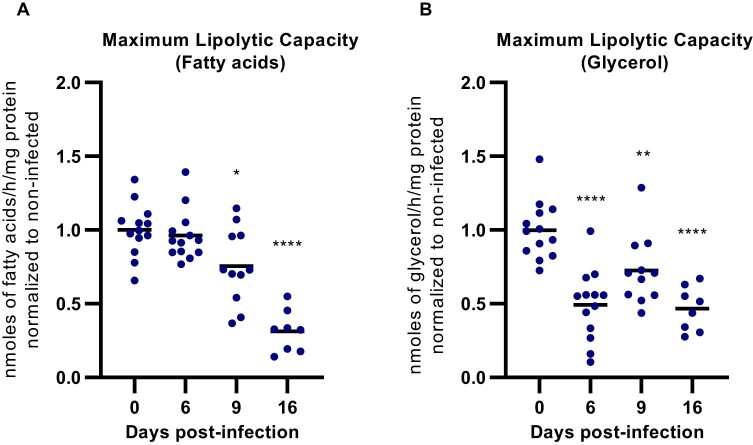
Extended Data Fig. 4. Effect of T. brucei infection on maximum lipolytic capacity.
Ex vivo release of (a) FFAs and (b) glycerol from AT explants under 20 µM stimulation with forskolin. Data are normalized to non-infected controls. n(day 0; 6; 9; 16) = 13, 13, 11, 8 mice examined over 2 independent experiments.). Statistical analysis was performed with one-way ANOVA using Sidak’s test for multiple comparisons. *, P < 0.05; **, P < 0.01; ****, P < 0.0001. Statistical source data contains additional parameters.

