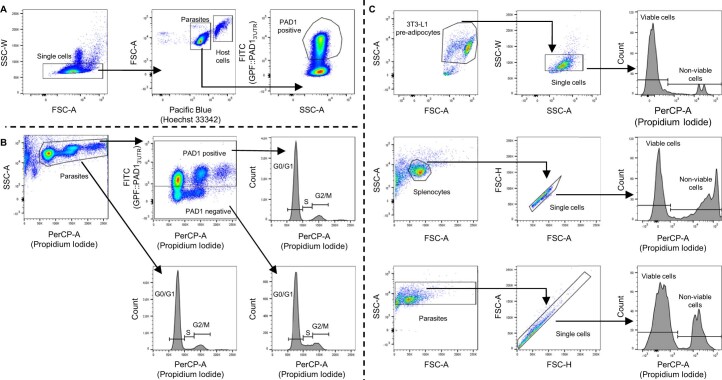
Extended Data Fig. 10. Flow cytometry gating strategy.
(a) Parasites and host cells isolated from the AT were differentiated based on Pacific Blue (Hoechst 33342) intensity and stumpy forms of the parasite were identified based on positive FITC (GFP::PAD13’UTR) signal. (b) Parasites were selected based on positive PerCP (propidium iodide) signal. Cell cycle was analysed in the entire parasite population or within FITC (GFP::PAD13’UTR) positive and negative populations. Cell cycle stages were attributed based on PerCP (propidium iodide) signal distribution. (c) 3T3-L1 pre-adipocytes, splenocytes and parasites were identified based on SSC-A vs FSC-A gating. Non-viable cells were identified based on positive propidium iodide signal.

