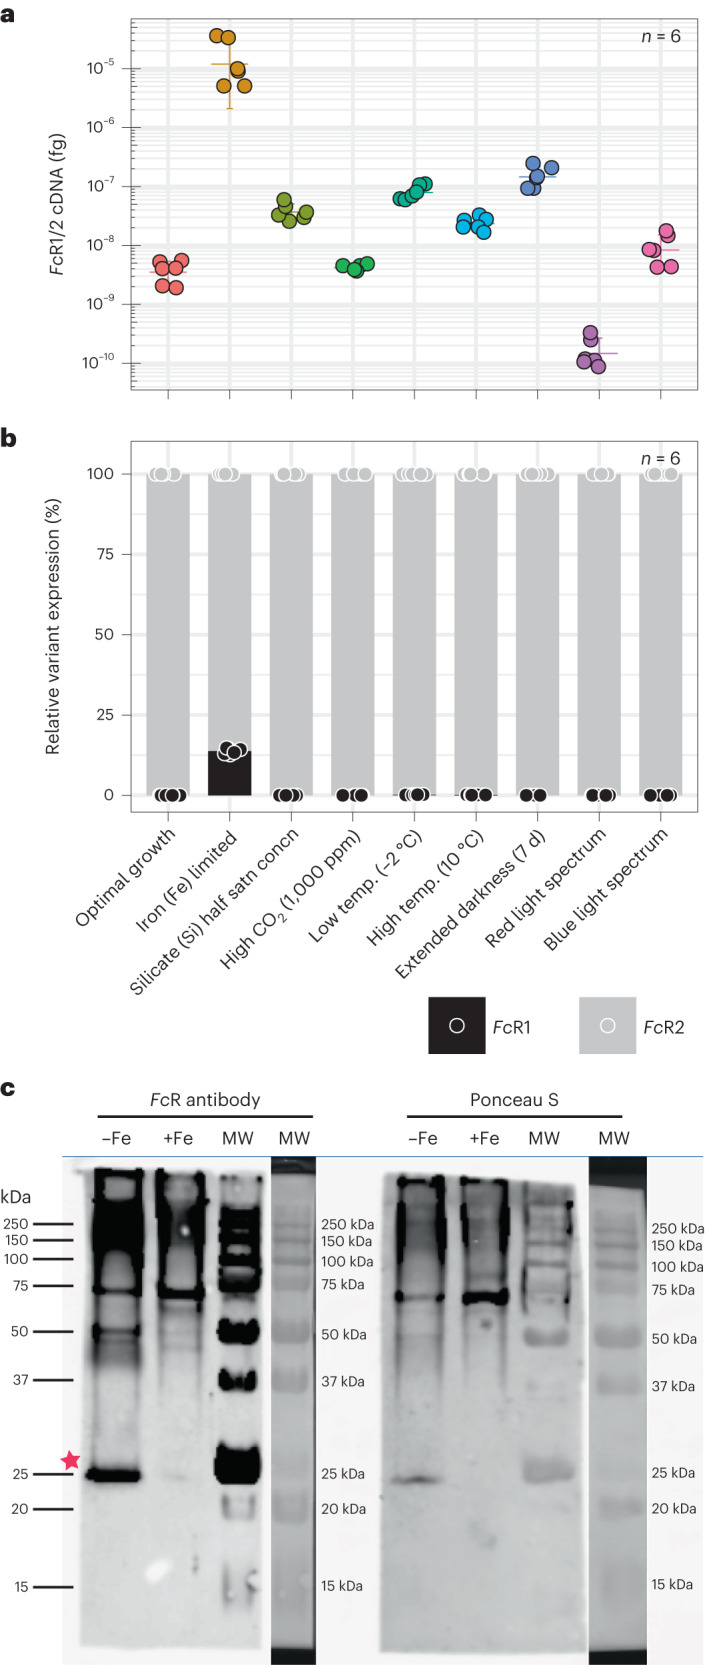
Fig. 3. Gene and protein expression of F. cylindrus rhodopsin (FcR) during iron-limited growth.

a, Absolute RT–qPCR gene transcript quantification of FcR1/2 under nine different growth conditions. Statistics are displayed as mean ± s.d. (n = 6) and individual datapoints are colour-coded by condition. b, Variant-specific RT–qPCR gene expression analysis of FcR1 and FcR2 under the same nine growth conditions as in a. Relative variant expression of total FcR expression is shown. Statistics are displayed as mean ± s.d. (n = 6) and individual datapoints are colour-coded by variant. c, Representative western blot analysis of FcR1/2 protein levels in iron-limited (−Fe) and iron-replete (+Fe) F. cylindrus using a custom FcR antibody from three independent experiments. The star indicates the FcR1/2 protein band with a predicted molecular weight between 29–32 kDa. Reversible Ponceau S staining before antibody probing was used as a loading control (right side). Molecular weight (MW) marker lanes are shown in different illumination modes. Note that probably due to FcR1 and FcR2 proteins having similar size after cleavage of the putative FcR1 N-terminal signal peptide (Fig. 1a), separate bands were not resolved for both proteins.
