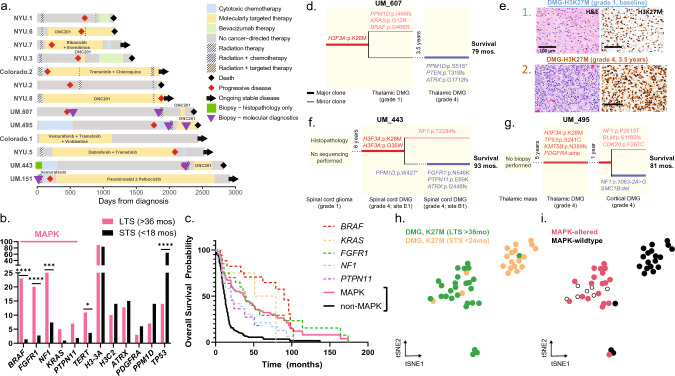
Fig. 1.
Characteristics of LTS patients. a Swimmer plot for 13 LTS patients demonstrates wide variety in timing and types of therapies. b Bar plot comparing oncogene mutation frequencies in LTS (n = 55) and molecular control (OS < 18 months, n = 208) cohorts highlights the higher frequency of MAPK pathway alterations in the LTS cohort. c Kaplan–Meier curve for combined LTS and molecular control cohort (n = 310) reveals that MAPK pathway genetic alterations are associated with improved OS at 36 months and shows differential survival among MAPK oncogenes. d Clonal map demonstrates molecular evolution of UM-607 from time of initial and subsequent biopsies, with thin lines for sub-clonal (< 10%) and thick lines for clonal branching events. e Histology stains demonstrate histologic evolution from low- to high-grade. f–g Clonal maps demonstrate the molecular evolution of UM-443 and UM-495 at various timepoints and tumor samples. h–i Joint analysis using t-SNE dimensionality reduction of LTS (23 patients, 27 tumors) and STS (20 patients; MNP2.0 cohort) H3K27M-DMGs reveals two clusters separating tumors from LTS/STS patients (h) and tumors with/without MAPK pathway alterations (i)

