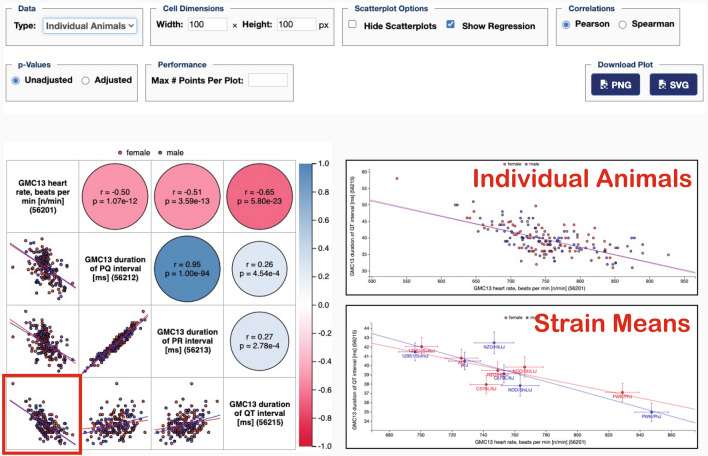
Fig. 3.
Scatterplots and correlations tool. Applied to German Mouse Clinic data for Collaborative Cross founder strains for ECG data. Users may view Pearson or Spearman correlations (see control panel above plot on the right). Thumbnail scatterplots lie beneath the diagonal (red, female; blue, male), and above the diagonal are color-coded correlation coefficients (the more intense the color, the higher the absolute value of the correlation coefficient) with circle size corresponding to p-values (the lower the p-value, the larger the circle). The red square on the lower-left cell indicates that we have clicked on that cell. From there we can get enlarged scatterplots as shown in the right insets for individual animals and for strain means. Data can be found at: https://phenome.jax.org/measures/56201, https://phenome.jax.org/measures/56212, https://phenome.jax.org/measures/56213, https://phenome.jax.org/measures/56215

