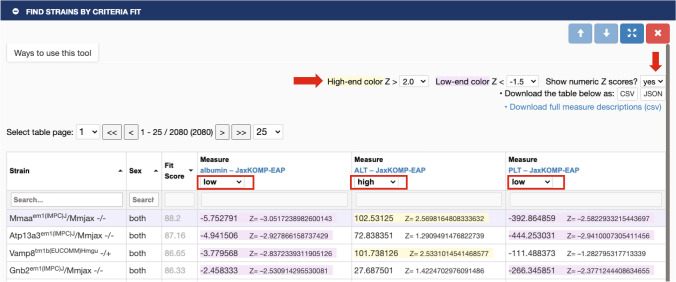
Fig. 7.
Find Strains by Criteria Fit Tool. Users select their measures of interest and then select this tool. In this example, we have chosen albumin, alanine transaminase (ALT), and platelet count (PLT). Users then select the Z-score threshold (right red arrow) and their criteria for each measure. Here we have chosen low, high, low, respectively (boxed in red). The results table is shown. Users may then opt to see Z-scores displayed (down red arrow) which give an indication of how extreme the measures are. In this example only one strain out of over 2000 meets our criteria, the knockout for gene Mmaa. Data can be found at: https://phenome.jax.org/komp/phenotypes/100151, https://phenome.jax.org/komp/phenotypes/100169, https://phenome.jax.org/komp/phenotypes/100291

