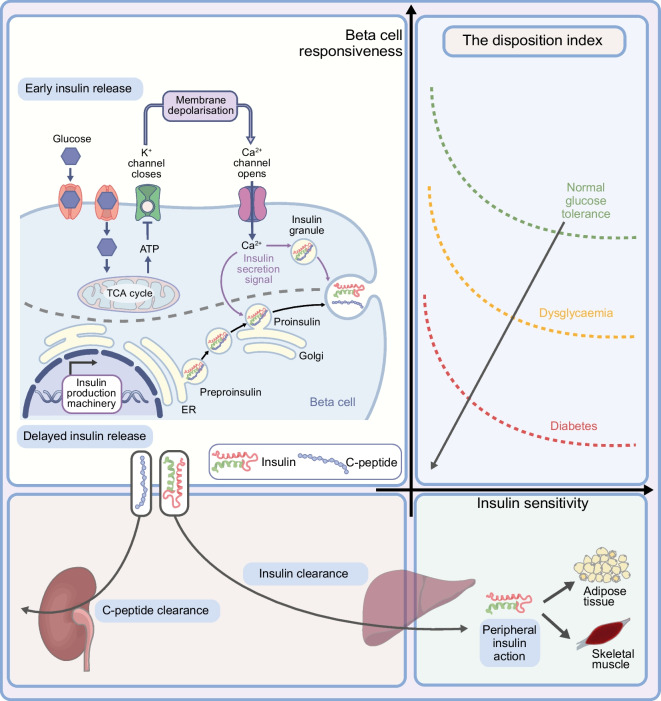
Fig. 1.
The DI results from the hyperbolic interaction of insulin secretion (beta cell responsiveness) and insulin sensitivity. Beta cell health can be quantified through the DI. Schematics representing insulin secretion and insulin sensitivity are shown. Early insulin release represents the response to a rapid glucose rise and is driven by the release of intracellular preformed insulin vesicles following glucose-induced beta cell depolarisation and calcium influx. This is followed by a second, delayed release of insulin in newly formed vesicles. Insulin and C-peptide are released in an equimolar ratio by the beta cell. Insulin is cleared by the first hepatic pass, with ~20% of the secreted insulin reaching peripheral target organs, while C-peptide is cleared by the kidney at a rate that is dependent on the GFR. The graph represents the dynamic interaction between insulin secretion and insulin sensitivity to maintain normoglycaemia. The transition from normal glucose tolerance to diabetes is shown by the failure to increase insulin secretion in response to changes in insulin sensitivity. ER, endoplasmic reticulum; TCA, tricarboxylic acid. This figure is available as part of a downloadable slideset

