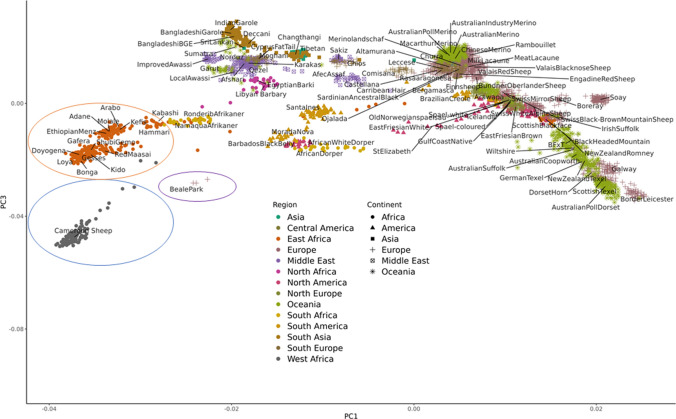
Fig. 2.
Principal component analysis illustrating the genetic diversity of sheep breeds from across the globe using 50K genotyping data (PC1 contributed 16% and PC3 7% to the variance). Included in the analysis are 50K genotypes from the HapMap dataset from Kijas et al. (2012), populations of East African sheep from Ahbara et al. (2019) (orange circle) and West and Central African sheep (blue circle) from Wiener et al. (2022). Cameroon sheep from a zoo collection at Beale Park (unpublished) are circled in purple

