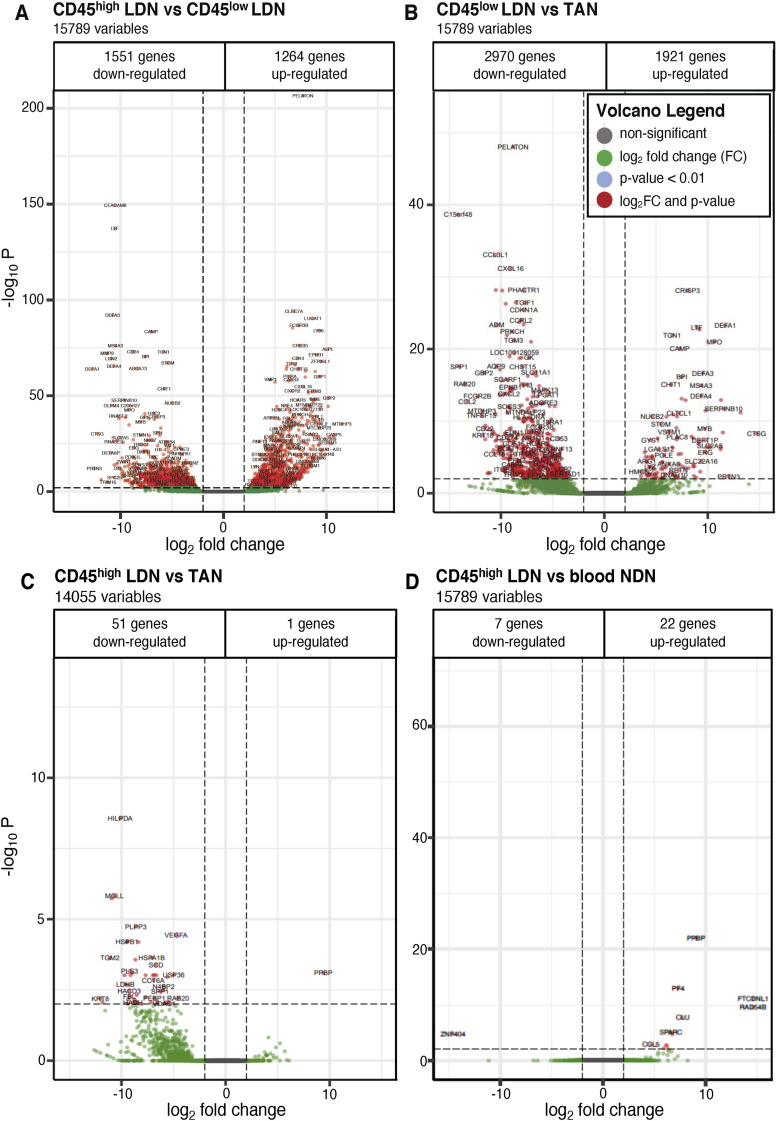
Figure S5. Volcano plots of differentially expressed genes between two neutrophil subtypes in blood and tumor from NSCLC patients.
The adjusted P-value threshold was set to P < 0.01 with a cutoff for the log2 fold change (LFC) of 2. (A) CD45high versus CD45low low-density neutrophils (LDN) from blood. (B) Blood CD45low LDN versus tumor-associated neutrophils. (C) Blood CD45high LDN versus tumor-associated neutrophils. (D) Blood CD45high LDN versus blood normal-density neutrophils. (A) For each volcano plot, the number of down- and up-regulated genes is indicated for the first neutrophil subtype named in the title (e.g., (A) shows up- and down-regulated genes in CD45high LDN compared with CD45low LDN).

