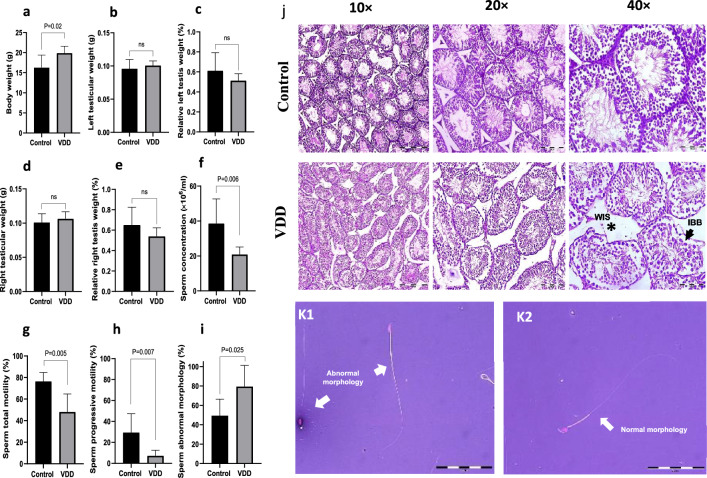
Figure 1.
Comparison between control and VDD groups of (a) body weight, (b, c) left testicular weight, (d, e) right testicular weight, (f) sperm concentration, (g) sperm total motility, (h) sperm progressive motility, and (i, k) sperm abnormal morphology. (j) Histological testicular structure. WIS wide interstitial space, the arrow, IBB irregular basement membranes. Data are presented as mean ± SD and analyzed by independent-samples T-test. P < 0.05. VDD vitamin D deficiency (N = 8).

