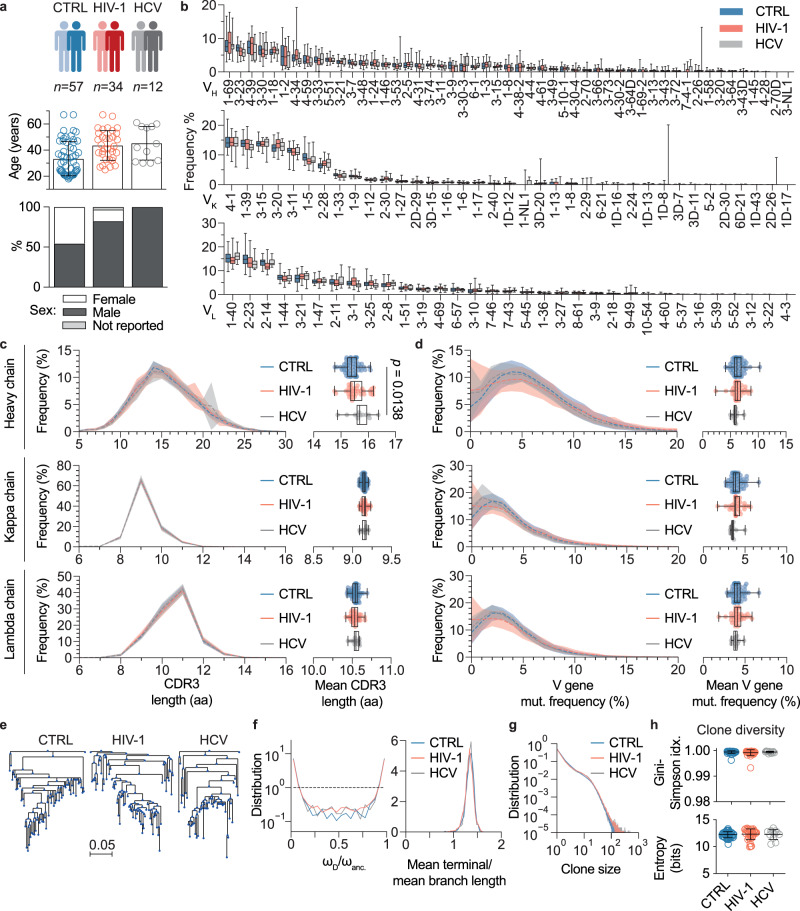
Fig. 3. IgG heavy chain repertoire characteristics of uninfected and chronically infected individuals.
a Cohort overview with age and sex distributions. Single dots in age distributions represent individuals, bar graphs and error bars depict mean cohort age ± SD. One individual (HIV-1) reported neither sex nor age. b V gene segment usage distributions for heavy, kappa, and lambda chains, ordered by descending frequencies according to the uninfected control (CTRL) group (n = 57 for CTRL, n = 34 for HIV-1, and n = 12 for HCV). c Mean CDR3 length distributions for heavy, kappa, and lambda chains in amino acids (aa). Left panel shows the mean CDR3 length distributions across individuals for each cohort (n = 57 for CTRL, n = 34 for HIV-1, and n = 12 for HCV) as solid lines and standard deviations as shaded areas. Right panel shows mean CDR3 amino acid length as dots for each individual and cohort statistics as box-plots. d Mean V gene nucleotide mutation (mut.) frequencies for heavy, kappa, and lambda chains. Representation of mean distributions (left panel) and individual means (right panel) as in c for all three cohorts (n = 57 for CTRL, n = 34 for HIV-1, and n = 12 for HCV). One-way ANOVA with a two-sided Tukey-HSD post-hoc test was performed on the means in c and d. e Representative examples of clone trees for the cohorts based on heavy chain sequences. f The weights (i.e., the number of leaves deriving from a given node) were determined for the common ancestor of each clone (ωanc.) and its immediate descendants (ωD). Distributions of their ratios (ωD/ωanc.) were plotted (left panel) to illustrate the clone tree skewness (dashed line = neutral, see methods for details). The right panel shows the mean terminal/mean branch length distribution for clone trees. g Clone size distribution for the cohorts. h Clone diversity determined by Gini-Simpson index and entropy (n = 57 for CTRL, n = 34 for HIV-1, and n = 12 for HCV). Data is presented as mean values ± SD. Box-plots in panels b–d depict 25% and 75% percentiles with medians as average lines and minimum/maximum values as whiskers. Source data are provided as a Source Data file.

