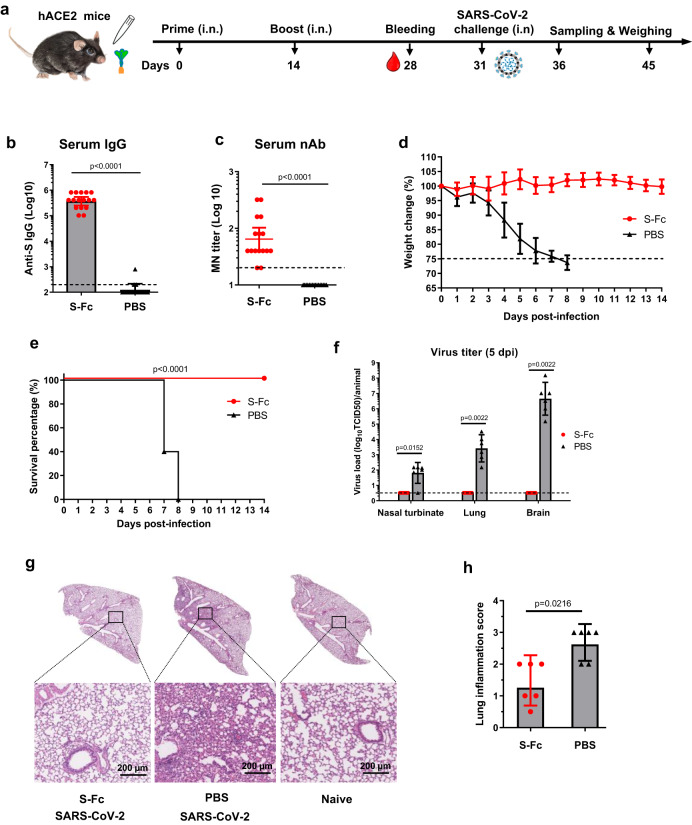
Fig. 3. Intranasal immunization by the S-Fc induces protective immunity to intranasal (i.n.) challenge with ancestral SARS-CoV-2.
a Ten μg of S-Fc or PBS with 10 μg CpG was i.n. administered into 8-week-old hACE-2 mice (n = 16 per group). Mice were boosted 14 days after primary immunization. Six mice in each group were euthanized at 5 days post-infection (dpi) for sampling and virus titration. The remaining 10 mice in each group are subjected to the body weight loss and survival analysis. b, c Serum anti-S-specific IgG Ab titers (b) and neutralizing Ab (c) in hACE2 mice (n = 16 per group). The S-specific IgG Ab titers were measured by coating ELISA plates with S protein; the micro-neutralization test determined the neutralizing Ab activity in the immunized sera. The data represent a geometric mean with 95% CI. d Body weight changes following the challenge. Seventeen days after the boost, groups of mice (S-Fc group, n = 10; PBS group, n = 10) were i.n. challenged with the ancestral SARS-CoV-2 (2.5 × 10⁴ TCID50) and weighed daily for 14 days. Mice were humanely euthanized at the end of the experiment or when a humane endpoint was reached. The data represent the mean ± SD. e Survival following virus challenge (n = 10 per group). The percentage of mice protected was shown by the Kaplan–Meier survival curve. f Viral titers in the nasal turbinate, lung, and brain at 5 dpi. The virus titers in the samples of the immunized and control mice (n = 6) were determined by CPE in Vero E6 cells cultured for 4 days. The viral titers were shown as TCID50 from each animal sample. The data represent a geometric mean with 95% CI. g Histopathology of the lungs from the challenged mice (n = 6 per group). Lungs were collected at 5 dpi. The lungs from uninfected mice were included as standard control (n = 6). The lung sections were stained with Hematoxylin-Eosin (H & E). The representative slides are shown. All scale bars represent 200 µm. h The inflammatory responses of each lung section (n = 6 per group) were scored blindly and shown as geometric mean with 95% CI. The statistical analyses were performed by Mann–Whitney test (two-tailed) (b, c, f, h) and Log-rank (Mantel-Cox) test (e). Dash lines indicate LOD or humane endpoint (d). Source data are provided as a Source data file.

