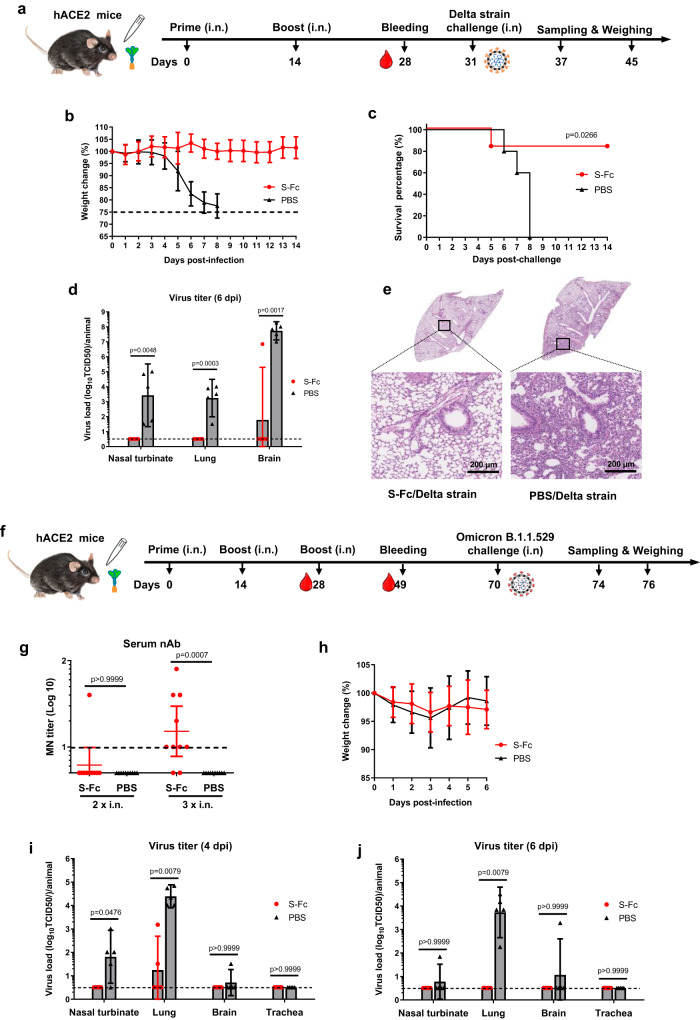
Fig. 4. Intranasal immunization by the S-Fc induces protective immunity to intranasal challenge with SARS-CoV-2 Delta or Omicron variants.
a The 8-week-old hACE-2 mice (n = 10–11) were i.n. immunized by 10 μg S-Fc or PBS with 10 μg CpG and boosted 14 days later. b Seventeen days after the boost, S-Fc (n = 11) and PBS (n = 10) groups were i.n. challenged with Delta strain (2.5 × 10⁴ TCID50). Six mice in S-Fc group and 5 mice in PBS group were subjected to the body weight loss and survival analysis by the Kaplan–Meier survival curve (c). The remaining five mice in each group were euthanized at 6 dpi for sampling the nasal turbinate, lung, and brain and measuring the Delta virus titers by TCID50 (d). e Lungs (n = 5 per group) were collected at 6 dpi. The lung sections were stained with Hematoxylin-Eosin (H & E). A representative lung image from 5 lungs was shown. f The 8-week-old hACE-2 mice were i.n. immunized by 10 μg S-Fc (n = 10) or PBS (n = 10) with 10 μg CpG and boosted 14 and 28 days later, respectively. Mice were i.n. challenged with the Omicron B.1.1.529 (1 × 10⁶ TCID50) 42 days after the boost. g Two weeks after the first or 3 weeks after the second boost, sera from 10 mice per group were measured for the neutralizing Ab titers. h Groups of 10 mice were weighed daily for 4 or 6 days after the challenge. i, j The Omicron B.1.1.529 virus titers were determined at 4 or 6 dpi in the nasal turbinate, lung, and brain of the S-Fc immunized and control mice (n = 5). Supernatants of the tissue homogenates were added to VAT cells and incubated for 4 days; the viral titers were shown as TCID50. The body weight data in (b) and (h) were shown as mean ± SD, while the data in d, g, i, and j represent a geometric mean with 95% CI. The Mann–Whitney test (two-tailed) was used for the statistical assays (d, g, i, j), while the Log-rank (Mantel-Cox) test was used for the survival analysis (c). Dashed lines represent LOD. Source data are provided as a Source data file.

