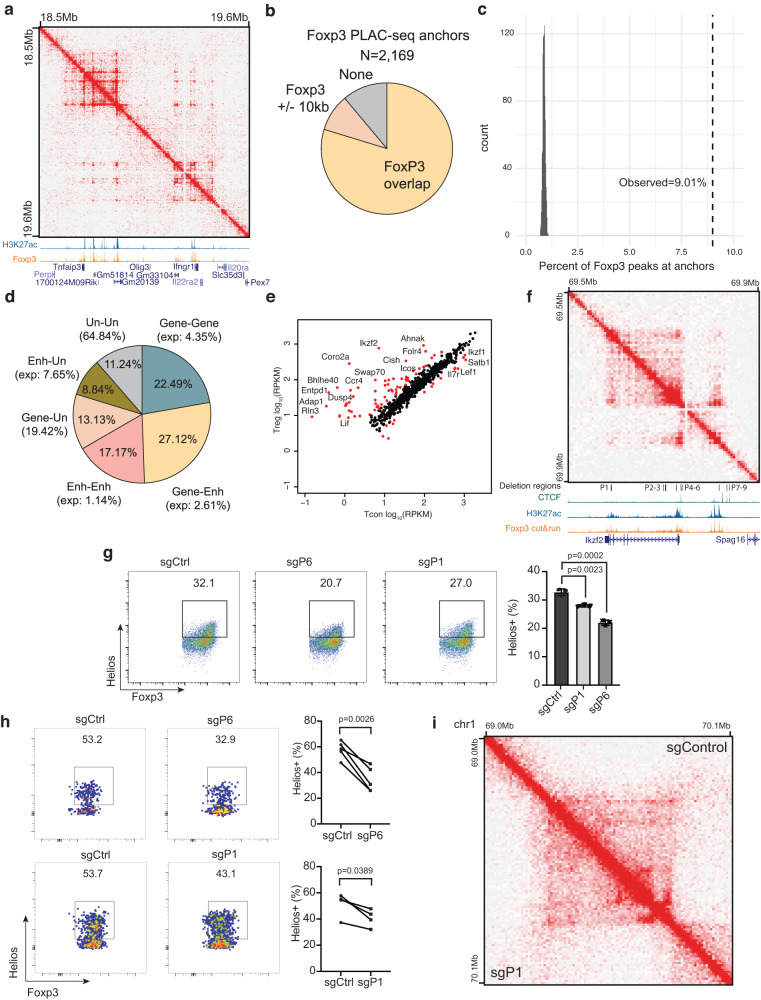
Fig. 6. Foxp3-associated chromatin interactions link distal enhancers to Treg signature genes.
a Chromatin contact map of Foxp3 PLAC-seq data near the Treg specific genes Tnfaip3 and Ifngr1. Shown below are genome browser tracks of H3K27ac ChIP-seq (blue) and Foxp3 CUT&RUN (orange). b Pie chart showing the fraction of Foxp3 PLAC-seq anchors containing a Foxp3 binding site (yellow), within 10 kb of a Foxp3 binding site (+/− 1 bin, tan), or without a Foxp3 binding site (gray). c Plot showing the fraction of Foxp3 binding sites associated with PLAC-seq interactions. The observed overlap (9.01%) is shown as a dashed line compared to random permuted overlaps (1000 iterations, gray). d Pie chart showing the fraction of Foxp3 PLAC-seq peaks that link genes (Gene), enhancers (Enh), or unannotated regions (Un). Enhancers are defined as distal H3K27ac peaks. Unannotated regions are sites that do not overlap gene transcription start sites or distal H3K27ac peaks. e Gene expression in CD4+ Tcon (x-axis) and Treg cells (y-axis) of genes whose TSS overlaps with Foxp3 PLAC-seq interactions. Points in red are differentially expressed genes between Treg and Tcon cells (FDR1%, 2-fold minimum change). f Foxp3 PLAC-seq data near the Ikzf2/Helios locus. Shown below are ChIP-seq and CUT&RUN tracks and the locations of Foxp3 binding sites targeted for CRISPR deletion (P1-P9). g The effect of CRISPR deletion of Foxp3 binding sites P1 or P6 on Helios expression in Treg cells in vitro. p-values were calculated by an unpaired, two-sided Student’s t test. h In vivo validation of the effect of P1 or P6 deletion on Helios expression. Treg cells transduced with gRNAs targeting P1 (n = 4) or P6 (n = 5) were co-transferred with Tregs with control gRNAs into the same Rag1-/- mice, and Helios expression was analyzed 2 weeks post transfer. p-values were calculated by a paired, two-sided Student’s t test. Data are represented as mean ± s.e.m. Representative data of two independent experiments (g, h) are shown. Source data are provided as a Source Data file. i Hi-C interaction map at the Ikzf2/Helios gene in Treg cells transduced with control gRNAs (upper right) or gRNAs targeting P1 (lower left).

