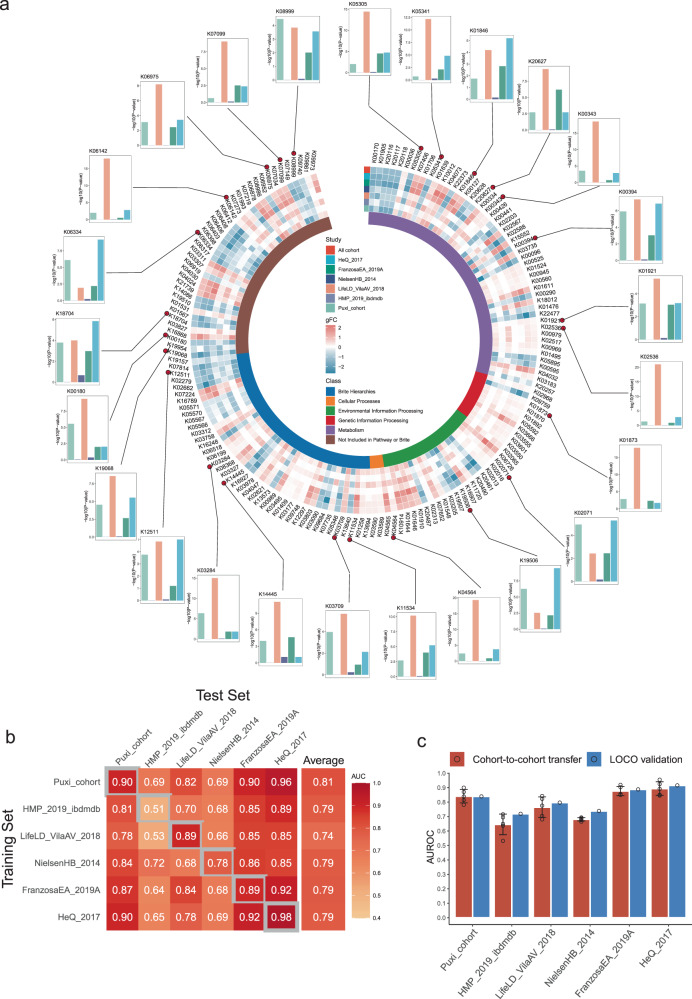
Fig. 3. Identification of IBD diagnostic markers by demonstrating variations of Kyoto Encyclopedia of Genes and Genomes (KEGG) orthology (KO) across different IBD cohorts.
a The circular complex heatmap displays the 162 most significant KO genes (P < 1×10⁻¹²), as calculated using a two-sided Wilcoxon test with FDR-corrected P values in the cross-cohort analysis. The inner-circle heatmap shows the generalized fold change (gFC) values of these 162 KO genes, with red indicating enriched and blue indicating depleted in IBD. The outer-circle bar chart displays the p-values of 25 featured KO genes in each cohort used for modeling. b The IBD classification accuracy was measured using AUROC for classifiers trained on the KO genes abundance profiles. The classification accuracy was evaluated using 10-fold cross-validation within each cohort (gray boxes along the diagonal) and cohort-to-cohort model transfer (external validations off-diagonal). c The classification models accuracy, as evaluated by AUROC on a hold-out cohort, improves when functional data (KO genes) from all other cohorts are combined for training using leave-one-cohort-out (LOCO) validation, compared to models trained on data from a single cohort (cohort-to-cohort transfer). The error bars indicate the mean ± sd, n = 5. Source data are provided as a Source Data file.

