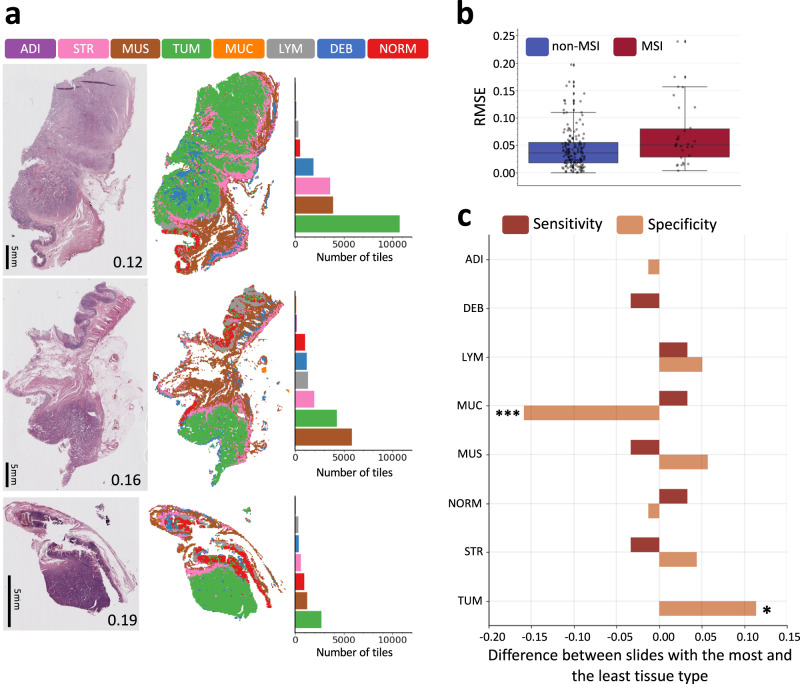
Fig. 3. Impact of slide selection on MSIntuit.
a Impact of tumour heterogeneity on MSIntuit prediction on a representative non-MSI case. Left: 3 slides picked from different blocks of the same tumour. The number on the bottom right corner of each slide corresponds to the tool’s prediction for the given slide. Middle: segmentation maps using a model trained to categorise tissue into one of the 8 following categories: adipose (ADI), debris (DEB), lymphocytes (LYM), mucin (MUC), smooth muscle (MUS), normal colon mucosa (NORM), cancer-associated stroma (STR), colorectal adenocarcinoma epithelium (TUM). Right: number of tiles belonging to each category. The slide with the largest amount of tumour was the closest to 0; as this patient is non-MSI, this slide gave the best prediction. b MSIntuit’s predictions variability due to using different slides available for the same patient, for 200 patients with one to four additional slides of the tumour available. Root mean squared errors (RMSE) of slide prediction and the average of the corresponding patient’ slides were computed and resulted in an average RMSE of 0.04 and 0.07 for non-MSI and MSI patients respectively. Center corresponds to the median, lower, and upper hingers to the first and third quartiles, whiskers to the hist/lowest value no further than 1.5 × IQR (inter-quartile range). c Difference of sensitivity/specificity when selecting slide with the highest and lowest amount of each tissue type was computed for the 200 tumours with multiple slides. Choosing the slide with the lowest amount of mucin and largest amount of tumour resulted in a significantly better specificity (+15 points, p < 0.001 and +10 points respectively, p < 0.05). Other categories were not significantly associated with a better sensitivity or specificity. P-values were computed using a McNemar test of homogeneity. No adjustment for multiple comparisons were made. Source data are provided as a Source Data file.

