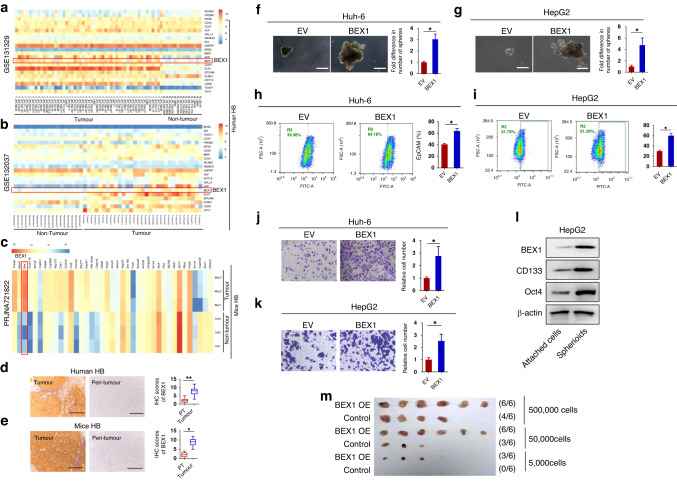
Fig. 1. BEX1 overexpression promotes the self-renewal of HB cells.
Analyses of BEX1 expression in (a, b) two human HB datasets and (c) one mice HB dataset. These heatmap figures were generated using three public datasets (GSE131329, GSE132037, and PRJNA721822). Specifically, stemness related genes were extracted, and the signal values were converted by log2(exp+1) for pheatmap clustering analysis. The false discovery rate (FDR) was used to determine the threshold of the p-value in multiple tests. A threshold of the FDR ≤ 0.05 was used to judge the significance of gene expression differences. In these heatmap data, BEX1 was elevated in both human and mouse HB tissues compared to non-tumour tissues, which has a statistically significant difference (FDR ≤ 0.05). d IHC analysis of BEX1 expression in clinical HB samples (n = 58). e IHC analysis of BEX1 expression in c-Myc-driven HB-like liver tumours in mice (n = 6). Scale bars: 50 μm. f, g Spheroid formation assays were performed in Huh-6 and HepG2 cells with treatments as indicated. Scale bars: 20 μm. h, i Flow cytometric analysis of the EpCAM+ cell population in Huh-6 and HepG2 cells with treatments as indicated. j, k The invasion of HB cells was examined by performing an invasion chamber assay. l Levels of BEX1, CD133, Oct4 in spheroids and attached cells were detected by western blotting. β-actin was used as a loading control. m Limiting dilution xenograft formation of HepG2 cells infected with Lv-BEX1 or Lv-Control (n = 6 per group). IHC immunohistochemistry. *P < 0.05, **P < 0.01.

