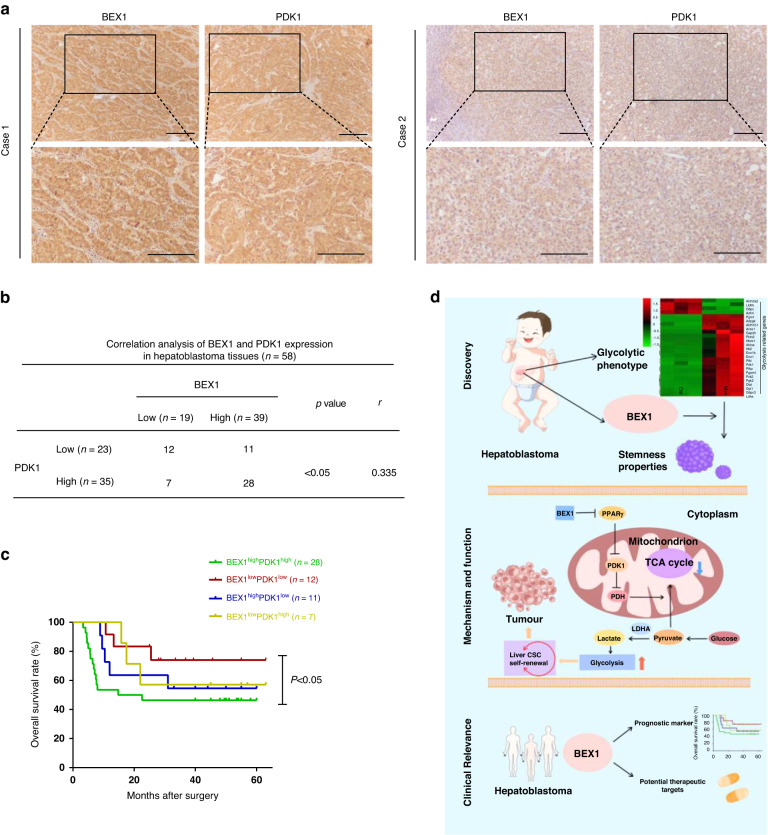
Fig. 8. BEX1 positively correlates with PDK1 in HB patients.
a IHC analysis of BEX1 and PDK1 expression in clinical HB samples (n = 58). Upper scale bars: 50 μm; lower scale bars: 20 μm. b Spearman’s rank correlation analysis of BEX1 and PDK1 expression in clinical HB samples. c Kaplan–Meier analysis of the prognostic value of combining BEX1 and PDK1 in HB patients. p < 0.05 refers to BEX1highPDK1high group vs BEX1lowPDK1low group. d Schematic diagram showing that BEX1 supports the stemness of hepatoblastoma by facilitating Warburg effect in a PPARγ/PDK1 dependent manner.

