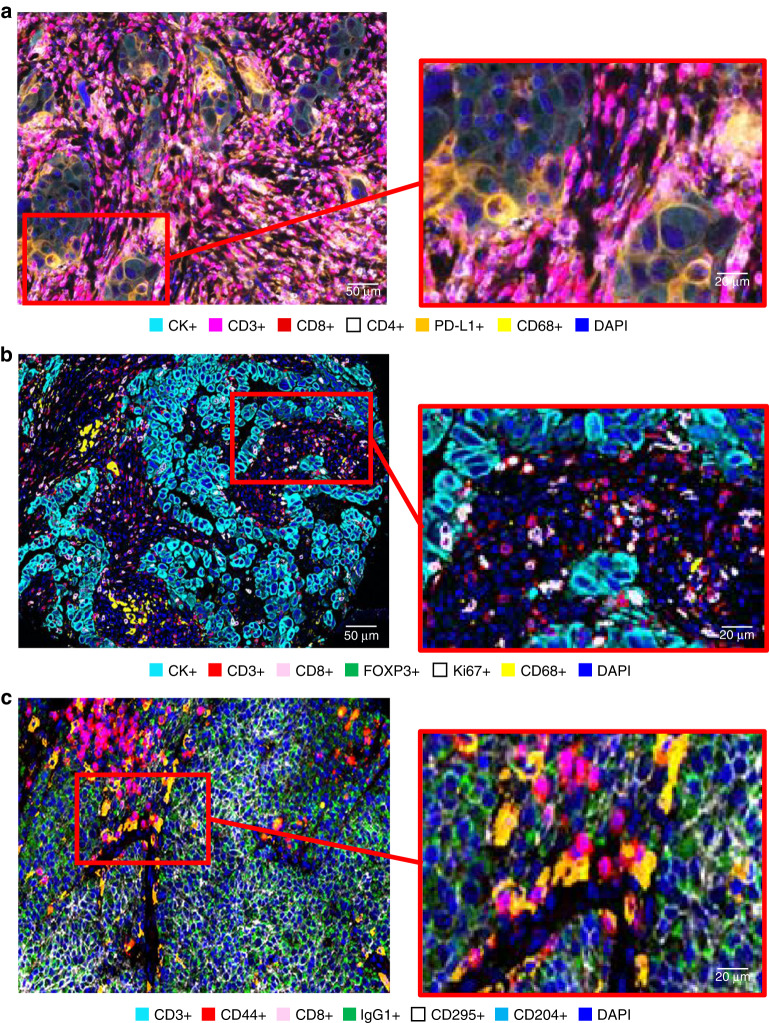
Fig. 2. Representative examples of multiplexed images from lung cancer tissue.
Composite spectral mixing image and detail from six marker multiplex immunofluorescence panel using tyramide signal amplification (a), an image showing six important markers extracted from a 26 marker hi-plex methodology using barcoding base-oligonucleotides methodology and detail (b), and seven representative markers from a panel of 95 markers using Imaging Cyclic Staining platform and detail (c). a The image was generated using Vectra-Polaris 1.0.13 scanner system and InForm 2.4.8 image analysis software (Akoya Biosciences), b the image was generated using the PhenoCycler system and the QuPath (open sources), c the image was generated using the MACSima Imaging System and Qi Tissue™ Image Analysis Software (Miltenyi Biotec).

