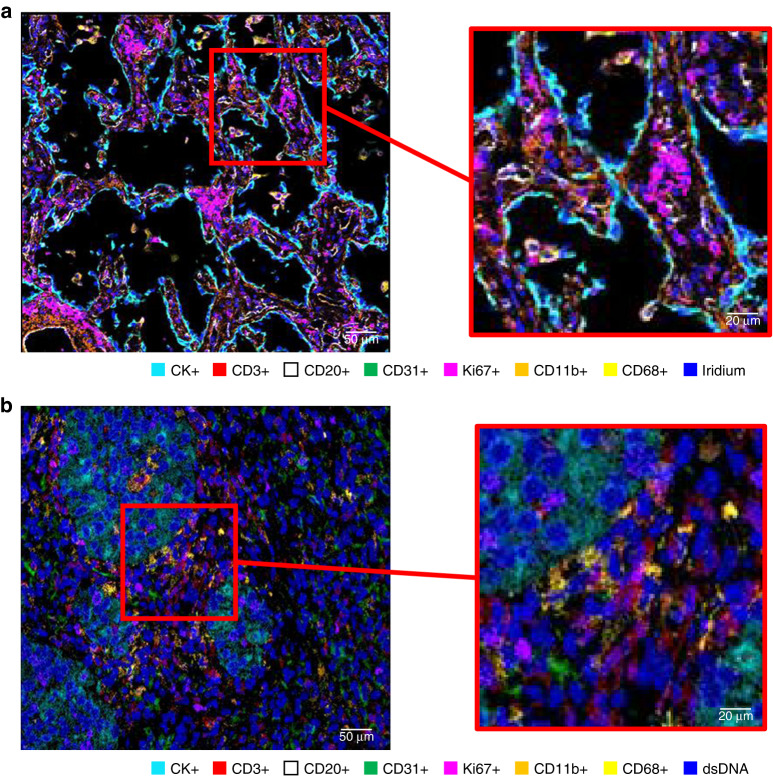
Fig. 3. Representative examples of multiplexed images from lung cancer tissue using image mass spectrometry methodology.
Image generated from a 36-plex cocktail panel showing seven important markers for immunoprofiling cancer tissues and detail (a). Similarly, an image generated from a 24-plex cocktail panel showing seven important markers for immunoprofiling cancer tissues and detail (b). a Image generated by Hyperion Imaging System (FLUIDIGM) and HALLO image analysis software (Indica Lab). b Image generated by MIBI scope I (IONpath) and HALLO image analysis software.

