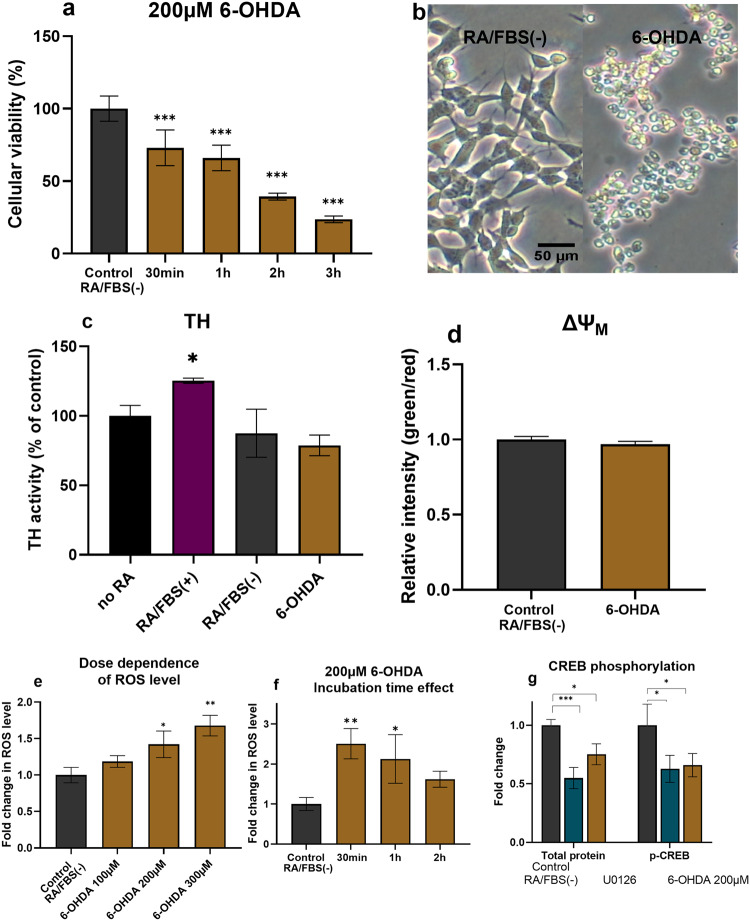
Fig. 5. In vitro PD model induced by 6-OHDA with differentiated SH-SY5Y cells, which were starved for 24 h in RA-only medium.
a MTT results acquired after cells exposure to 200 µM 6-OHDA for 30 min, 1 h, 2 h, and 3 h in RA/FBS(-) medium. The data is presented as a ratio of mean absorbance at 570 nm in the treated group (n = 6) compared to the control RA/FBS(-) group (n = 6). b Morphological analysis conducted after cells were exposed to 200 µM 6-OHDA for 30 min in RA/FBS(-) medium. cTyrosine hydroxylase expression assayed by ELISA with no RA: non-differentiated SH-SY5Y cells, RA/FBS(+): RA-differentiated cells. RA/FBS(-):RA-differentiated cells with 24 h FBS deficient medium incubation. 6-OHDA: RA/FBS(-) with 200 µM 6-OHDA for 30 min. d Mitochondrial membrane potential assay conducted with RA/FBS(-) cells exposed to 200 µM 6-OHDA for 30 min. The results are presented as a ratio of the mean green fluorescence intensity (FL1) divided by mean red fluorescent intensity (FL2) in the treated group (n = 3) compared to RA-control group (n = 3). e Reactive oxygen species (ROS) assay conducted with different concentrations (100 µM, 200 µM, 300 µM) of 6-OHDA for 30 min. The data are presented as a ratio of the mean fluorescent (FL1) intensity in the treated group (n = 3) compared to the RA/FBS(-) control group (n = 3). f Reactive oxygen species assay conducted with 200 µM of 6-OHDA for different incubation times (30 min, 1 h and 2 h). g Quantitative ELISA assay used to determine CREB phosphorylation after 200 µM 6-OHDA incubation for 30 min. The data are presented as the folded change of CREB phosphorylated protein (ng) per total protein (ng) in the treated group (n = 3) compared to the RA/FBS(-)control group (n = 3). n indicates the number of replicates per group and the error bars represent the standard deviation. The Dunnett test was used for multiple comparisons, and the Student t test was employed for comparing two groups, both using the Prism software. *P ≤ 0.05, **P ≤ 0.01, and ***P ≤ 0.001.

