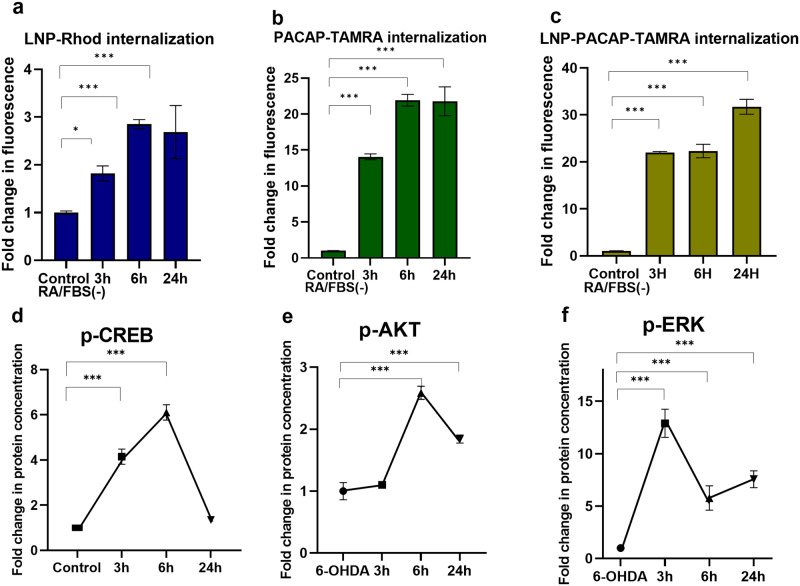
Fig. 8. Internalization kinetics (top row) and kinetic changes of CREB, AKT, and ERK phosphorylation in an in vitro PD model treated by nanoassemblies of PL-C and PACAP (bottom row).
a LNP cellular uptake measured by flow cytometry: Internalization of Rhodamine R18-labeled MO cubosomes (10 µM) in differentiated SH-SY5Y cells after 24 h of incubation (determined by FL2 fluorescence intensity). b Cellular uptake of PACAP: Internalization of PACAP-TAMRA (5 µM) in differentiated SH-SY5Y cells at different incubation times of 3 h, 6 h and 24 h (determined by FL2 fluorescence intensity). c Cellular uptake of LNP-PACAP: Internalization of LNP-PACAP-TAMRA by differentiated SH-SY5Y cells from 5 µM PACAP-TAMRA/10 µM LNPs mixture at different time points 3 h, 6 h and 24 h. The data of (a–c) was presented as a ratio of the mean intensity of FL2 in the treated group (n = 3) and the mean intensity of FL2 in the RA/FBS(-) control group. d Kinetic changes of CREB phosphorylation in the PD model. The ELISA assay was performed with plasmalogen-loaded PL-C LNPs, which were dispersed at total lipid concentration of 10 µM in the presence of 5 µM PACAP peptide. The different incubation times were 0, 3 h, 6 h, and 24 h following 30 min 6-OHDA exposure. e Kinetics changes of phospho-AKT expression levels in the treated PD model. ELISA assay was performed with plasmalogen-loaded nanoparticles PL-C, which were dispersed at same total lipid concentration of 10 µM in the presence of 5 µM PACAP. f Kinetic changes of phospho-ERK expression in the treated PD model measured by ELISA assay with plasmalogen-loaded nanoparticles PL-C at total lipid concentration of 10 µM in the presence of 5 µM PACAP peptide. The data of (d–f) is presented as a ratio of the quantity of p-CREB, p-AKT or p-ERK expression (ng) per total protein (ng) in the treated group (n = 3) and the quantity of p-CREB expression (ng) per total protein (ng) in the 6-OHDA group (n = 3). n indicates the number of replicates per group and the error bars represent the standard deviation. *P ≤ 0.05, **P ≤ 0.01, and ***P ≤ 0.001.

