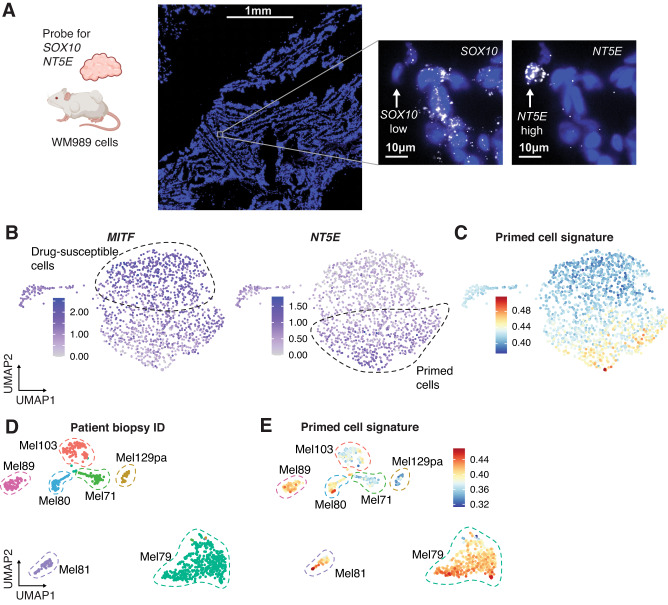
Fig. 2. Mouse models and patient samples contain cells expressing primed cell signatures.
A HCR RNA FISH of NT5E and SOX10 in a mouse PDX drug-naive tumor. Nuclei are shown in blue, and RNA for each respective probe is in white. The white arrow points to an example SOX10-low NT5E-high cell. The leftmost image is a large scan of the tissue section and the scale bar corresponds to 1 mm. The two images to the right are zoomed in on an example cell where the scale bar corresponds to 10 µm, n = 3 slides from one PDX tumor. Cartoon created with Biorender.com. B scRNA-seq on WM983B melanoma cell line. UMAP plots show the log10 normalized expression of MITF and NT5E in each cell. C UMAP showing WM983B scRNA-seq with each cell colored by the primed gene set signature derived from WM989 cells. D Analysis of scRNA-seq of melanoma patient biopsies from26, 27. The UMAP shows the different biopsies taken from each patient in different colors. E UMAP of patient scRNA-seq from (D) showing the primed cell gene set signature score. Within each biopsy, some cells have variable expression of genes associated with the primed state.

