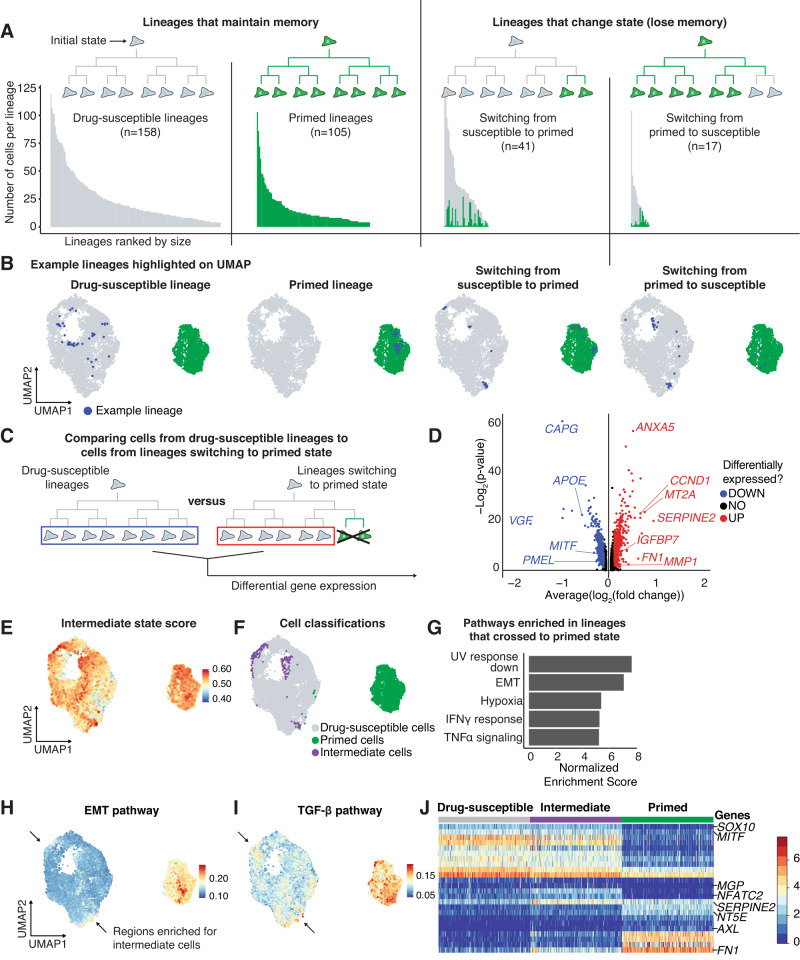
Fig. 3. An EMT-like state is activated early in the transition to the primed cell state.
A Bar graphs showing the size of each lineage organized based upon classification as drug-susceptible, primed, switching from drug-susceptible to primed, or switching from primed to drug-susceptible. Each bar represents an individual lineage, and the color of the bar indicates the state of the cell (green is primed and gray is drug-susceptible). In lineages that change state, the number of cells in each state is reflected by the colors in the bar. B UMAP plots showing an example lineage from each type of lineage in the data. The cells from the example lineage are highlighted in blue. C Schematic showing which cells from the drug-susceptible lineages (blue rectangle) and which cells from lineages switching from the drug-susceptible state to the primed state (red rectangle) were used to identify differentially expressed genes in transitioning cells. D Volcano plot representing the differential expression analysis outlined in (C). Red points represent genes upregulated in crossing lineages and blue points represent genes downregulated in crossing lineages. Wilcoxon rank sum test. E UMAP plot showing the gene set signature score of the upregulated genes in panel D (high score represents high expression of the gene set). F UMAP plot labeling the top 2% drug-susceptible cells expressing the crossing lineage gene set. We classify these cells as Intermediate state cells, and these cells are labeled in purple. G Bar graphs of the normalized enrichment score of the top 5 gene sets enriched in the crossing lineage gene set. H UMAP plot showing which cells have a high EMT pathway gene set signature score. Arrows point to drug-susceptible cells with high EMT scores. I UMAP plot showing which cells have high TGF-β signaling pathway gene set signature score. Arrows point to drug-susceptible cells with high TGF-β signaling scores. J Heatmap of the log10 normalized and scaled gene expression of cells in the drug-susceptible, intermediate, and primed state. The genes shown are the top differentially expressed genes between the primed and drug-susceptible states as well as select genes upregulated in the intermediate state.

