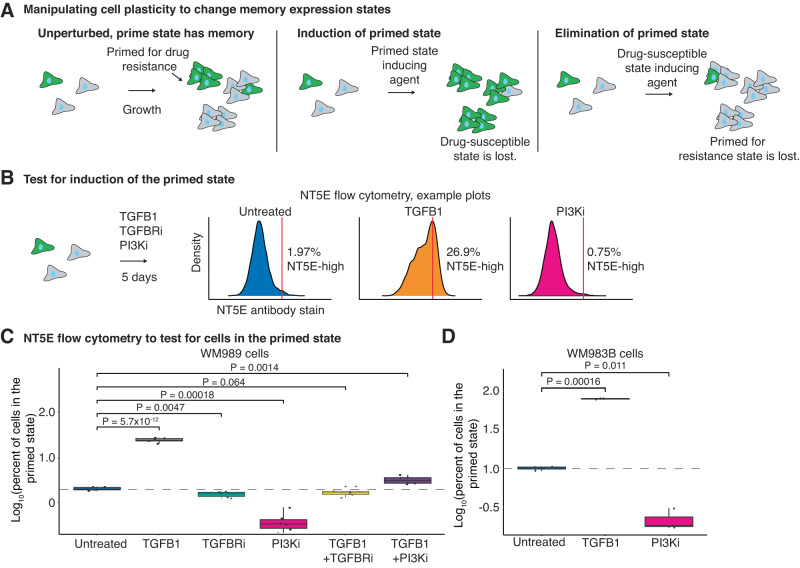
Fig. 4. TGFB1 and PI3K inhibition can modulate the number of primed cells in the population.
A Schematic showing the expected number of primed cells over time if cells are untreated, treated with a drug or protein that induces the primed state, or treated with a drug or protein that disrupts the primed state. B Example flow cytometry density plots from NT5E stained WM989 cells after 5 days of their respective treatments. C Box plot of the log10 percent of WM989 cells in the primed state after 5 days in each treatment. All conditions have four biological replicates each with six technical replicates. P values were calculated using a two-sided t-test. The dotted line represents the mean log10 percent of primed cells (set at 2%) in the untreated condition. D Box plot of the log10 percent of WM983B cells in the primed state after 5 days of each treatment. All conditions have two biological replicates each with three technical replicates. P values were calculated using a two-sided t-test. The dotted line marks the mean log10 percent of primed cells (set at 10%) in the untreated condition. For the box plots in (C) and (D) the center line is the median, the box is the interquartile range (IQR), and the whiskers indicate 1.5 times the upper and lower IQR. All data points are shown.

