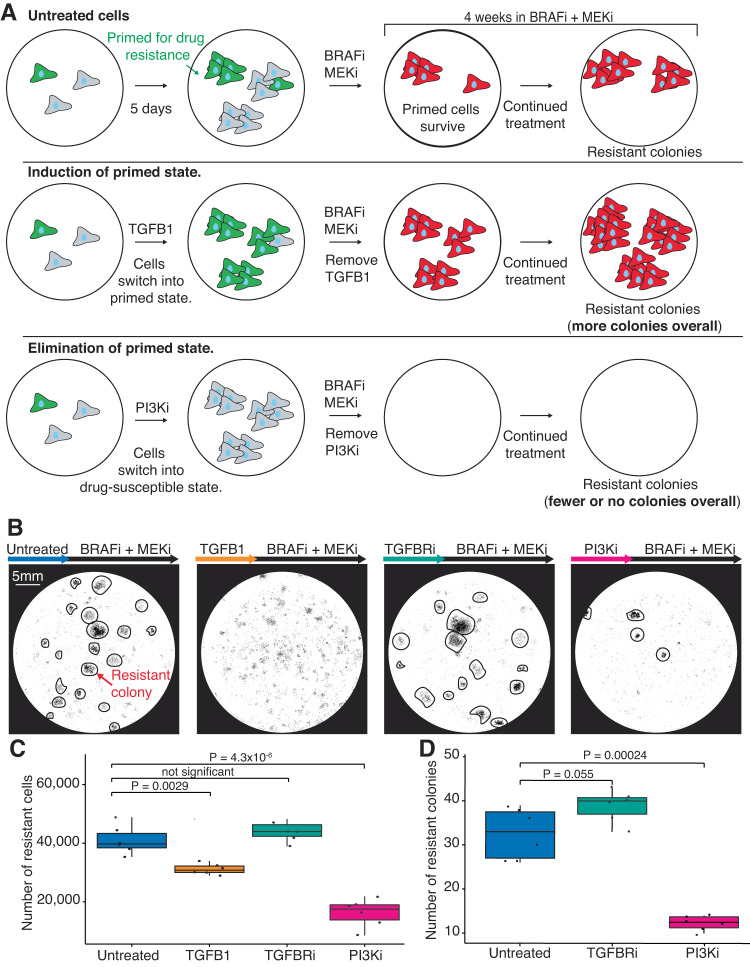
Fig. 6. Decreasing the number of primed cells results in a decrease in resistance.
A Schematic of the experimental design testing whether modulators of state switching affect the number of drug-resistant colonies (represented by red cells). In this experiment, we treated cells with the state-switching treatments for 5 days, removed the treatment, and then treated them with BRAFi/MEKi for 4 weeks. After 4 weeks we quantified drug resistance by counting the number of drug-resistant cells and the number of drug-resistant colonies. B Example images of fixed cells stained with DAPI for each condition after 5 days of pretreatment and 4 weeks of treatment with BRAFi/MEKi. Drug-resistant colonies are circled in black where readily identifiable. The scale bar in the first image represents 5 mm and applies to all images in the panel. C Box plot quantifying the number of drug-resistant cells from scans like those shown in panel (B) with six technical replicates. P values calculated using a two-sided t-test, n = 3 biological replicates. D Box plot quantifying the number of drug-resistant colonies (for each condition in which distinct colonies were visible) from images like those shown in panel (B) with six technical replicates. P values were calculated using a two-sided t-test, n = 3 biological replicates. For the box plots in (C) and (D) the center line is the median, the box is the IQR, and the whiskers indicate 1.5 times the upper and lower IQR. All data points are shown.

