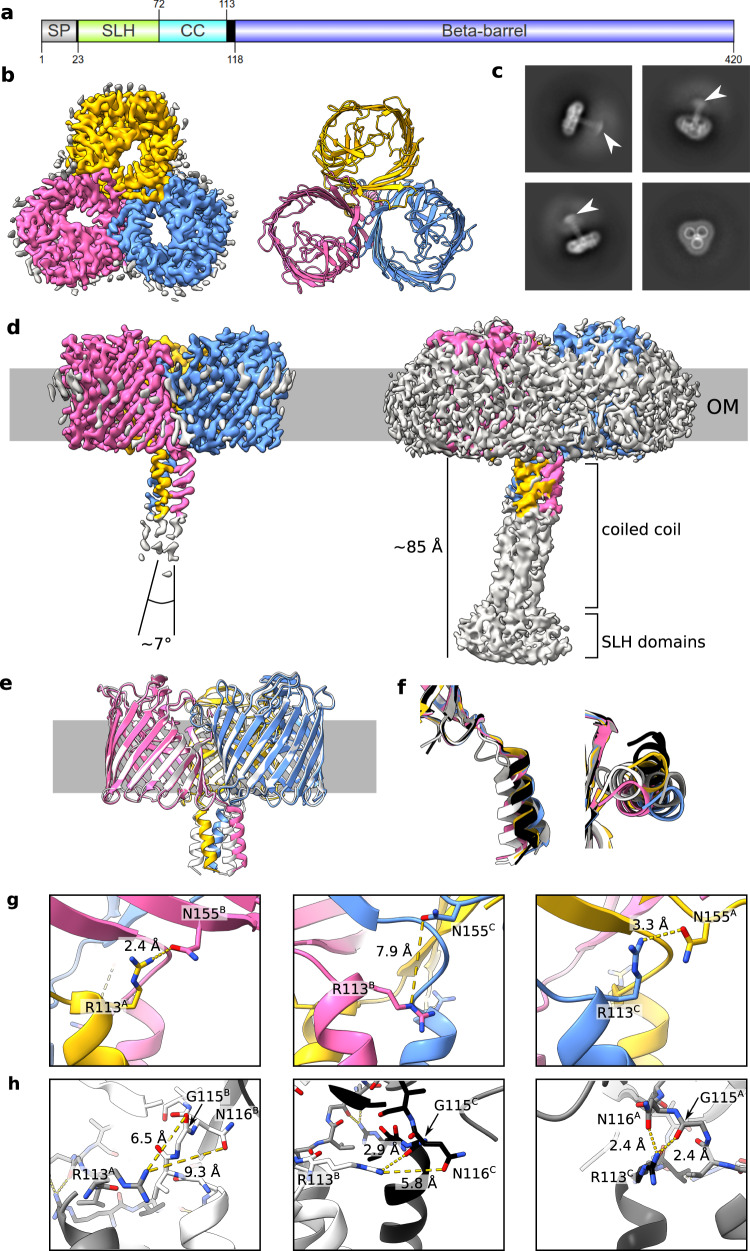
Fig. 1. Cryo-EM structures of VpOmpM1 expressed in E. coli and V. parvula.
a Schematic depicting VpOmpM1 (UniProt A0A100YN03) domain arrangement and boundaries. SP, signal peptide; SLH, S-layer homology; CC, coiled-coil. Generated using IBS 2.0103. b Structure of recombinant VpOmpM1. The cryo-EM density is shown on the left and the model is shown on the right as viewed towards the OM from outside the cell. c Representative 2D class averages. White arrowheads point to the diffuse SLH domain density. The edge of each square is 344.4 Å long. d Side view of the cryo-EM density at high (left) and low (right) contour level. The grey bar represents the outer membrane (OM). The diffuse grey density around the membrane region in the high contour view likely corresponds to lipid or detergent. e Superposition of structures from recombinant VpOmpM1 (in colour) and native VpOmpM1 purified from V. parvula (white). f Superposition of coiled-coils of protomers from the recombinant (yellow, pink, blue) and native (grey, white, black) VpOmpM1 structures. The structural alignment was performed on the β-barrel region only (not shown). Left—side view, right—view from the periplasm towards the OM. g, h Inter-protomer contacts at the β-barrel-stalk interface in the recombinant (g) and native (h) structures. The protomer (A, B, C) for each sidechain is indicated in superscript.

