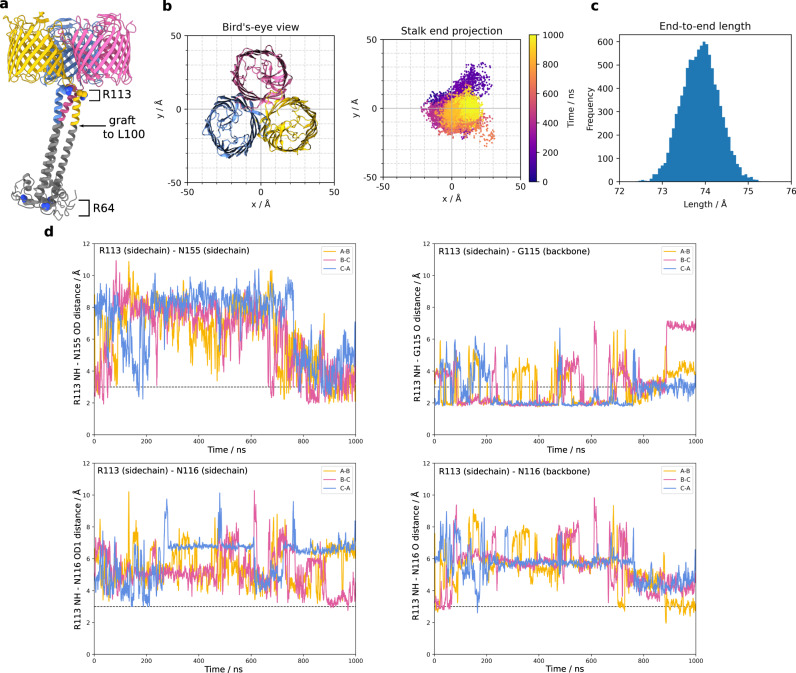
Fig. 2. All-atom molecular dynamics simulations with native VpOmpM1.
a The AlphaFold2 prediction for the stalk (grey) was grafted onto the N-terminus of the first residue (L100) modelled into the experimental density of native VpOmpM1 (in colour). R64 (bottom of SLH domain) and R113 are shown as space filling models. b Bird’s-eye-view of the β-barrel region from outside the OM (left) and a plot of the stalk end projection (centre of mass of the R64 Cα atoms) over the 1 μs simulation (right). The observation point in the left and right panels is equivalent. c Frequency distribution of stalk lengths (R64-R113 Cα-Cα) observed throughout the simulation. d Distances between the R113 sidechain and interacting sidechain atoms throughout the simulation. The dotted line denotes an inter-atomic distance of 3 Å. The equivalent plots for a replicate simulation and a simulation without the AlphaFold2 graft are presented in Supplementary Fig. 5.

