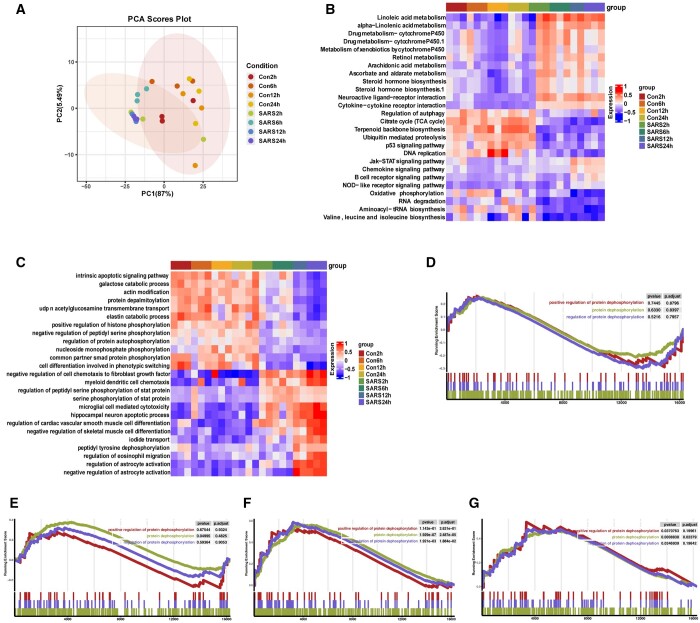
Figure 2.
(A) PCA of A549 cells infected with SARS-CoV-2 at different hours post-infection (hpi) compared to uninfected cells. (B–C) Heatmap of the top 26 KEGG pathways (B) and top 25 GO pathways (C) in SARS-CoV-2 infection groups and uninfected groups at different time course of post-infection. GSEA was performed against the KEGG datasets or GO dataset for BPs. The color of the lattices represents the false discovery rate value for each enriched KEGG term or GO term. (D–G) Enrichment analysis of GO involved the dephosphorylation pathway. GSEA of 2 hpi (D), 6 hpi (E), 12 hpi (F), 24 hpi (G), P-value and P-adjusted are indicated. Con2h, mock-infected A549 cells (2 hpi); SARS2h, SARS-CoV-2-infected A549 cells (2 hpi); Con6h, mock-infected A549 cells (6 hpi); SARS6h, SARS-CoV-2-infected A549 cells (6 hpi); Con12h, mock-infected A549 cells (12 hpi); SARS12h, SARS-CoV-2-infected A549 cells (12 hpi); Con24h, mock-infected A549 cells (24 hpi); SARS24h, SARS-CoV-2-infected A549 cells (24 hpi)

