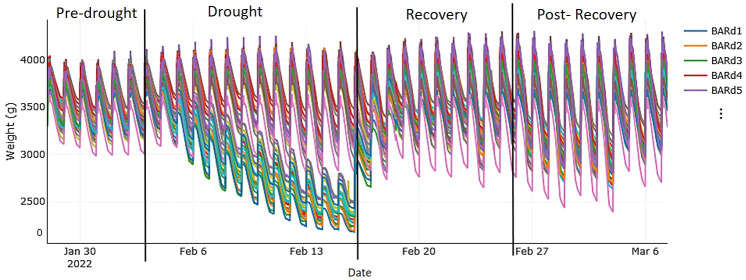
Figure 1.
Autonomous, simultaneous, and continuous measurements of the system weight (i.e., weight of all components: plant, soil, pot, and all sensors) of each measurement unit taken from the first to the last day of the experiment running on the Plantarray (Plant-Ditech) and visualized with SPAC Analytics. The phases of the experiment were as follows: “pre-drought,” with well-watered (control) treatment (soil water content of each pot maintained at pot capacity) for 7 days; “drought,” with gradual deficit irrigation (80% of the plant's own previous day transpiration) for 12 days; “recovery period,” with control treatment for 10 days; and “post-recovery,” with slightly reduced irrigation to account for declining water demand of maturing plants. Each colored line represents one plant; as an example, the first five plants of drought-stressed cv. Baronesse are shown in the legend.

