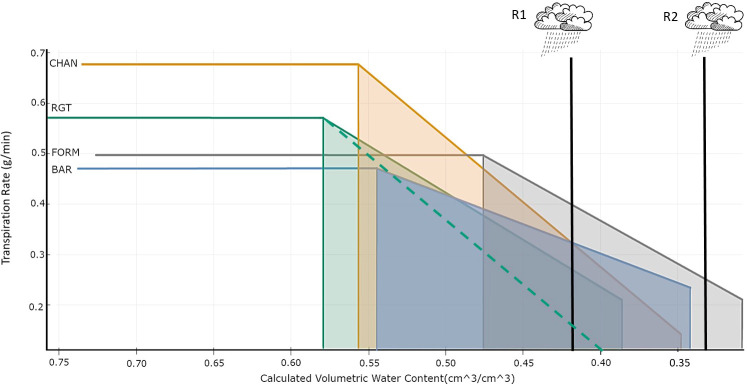
Figure 10.
Risk management in an uncertain environment. Bilinear model describing the relationship between transpiration rate (TR_rate, g/min) and volumetric soil water content (cm3/cm3) per cultivar. The horizontal line indicates the maximum transpiration rate (TRmax). The breakpoint (left vertical line) indicates θcrit. The vertical line on the right indicates the terminal drought point. The slope shows the reduction of the TR_rate. Two hypothetical rain events (R1 and R2) are shown. The dotted green line indicates the hypothetical TR_rate decrease of RGT had it followed the same non-conserving behavior as CHAN and decreased TR_rate with the same steepness.

