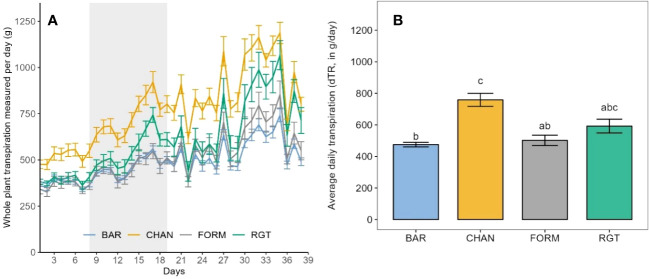
Figure 4.
Transpiration of the well-watered control plants as observed during the whole experimental phase (39 days on the Plantarray). (A) Daily measurements of whole-plant transpiration from the first to the last day on the Plantarray. For comparison (with Figure 5) the 12-day drought period is also indicated (gray shaded area). (B) Average daily tanspiration. Letters indicate statistically significant differences between the groups (p < 0.05, pairwise comparisons Tukey’s HSD), and bars represent the standard error. The peaks in (A) are due to high PAR (photosynthetically active radiation) and VPD.

