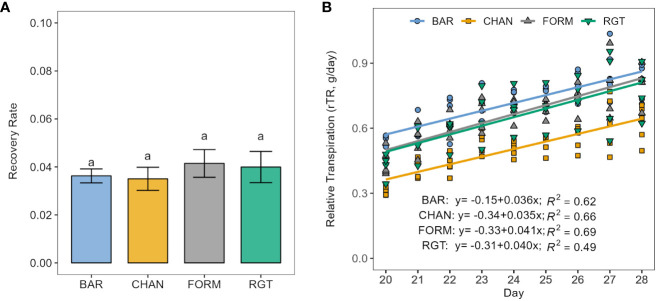
Figure 6.
Recovery from drought stress (resilience) upon re-irrigation. (A) Recovery rate calculated as the slope of the linear regression between relative transpiration (rTR) and time in days of the recovery period. Letters indicate statistically significant differences between the groups (p < 0.05, pairwise comparisons Tukey’s HSD) and bars represent the standard error. (B) The respective linear models per cultivar.

