Figure 9.

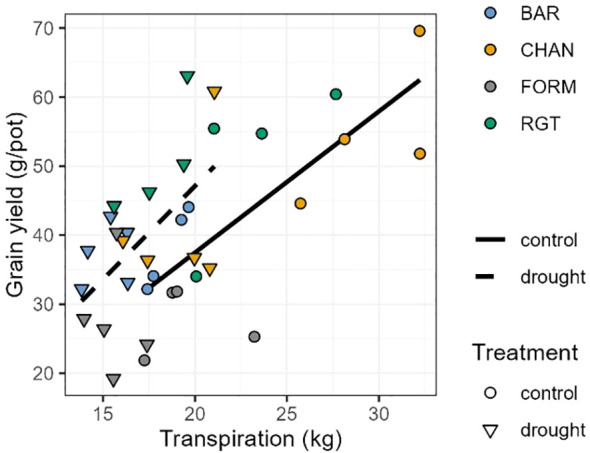
Pearson correlation between cumulative transpiration and grain yield. For well-watered (control; solid line and circles; r = 0.76, p < 0.01) and drought-stressed (dashed line and triangles; r = 0.55, p = 0.015) plants.

Pearson correlation between cumulative transpiration and grain yield. For well-watered (control; solid line and circles; r = 0.76, p < 0.01) and drought-stressed (dashed line and triangles; r = 0.55, p = 0.015) plants.