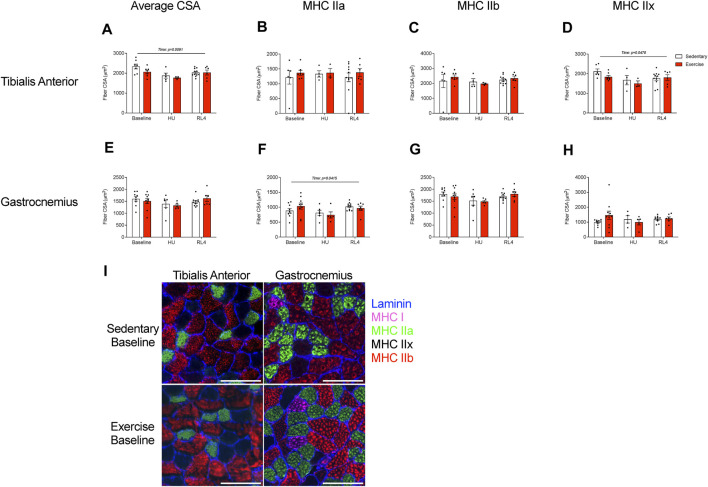
FIGURE 5.
The fiber cross-sectional area (CSA) of the (A–D) tibialis anterior and (E, F) gastrocnemius was examined at baseline, HU, and RL4 time points for both sedentary and exercise groups. Both the tibialis anterior and gastrocnemius from all three time points (baseline, HU, and RL4) were sectioned and analyzed for (A, E) average CSA, (B, F) myosin heavy chain (MHC) type IIa fibers, (C, G) MHC type IIb fibers, and (D, H) MHC type IIx fibers. (I) Representative immunofluorescent cross-sectional images of the TA and gastrocnemius for baseline sedentary and exercise groups indicating fiber-type (blue = laminin, green = MHC IIa, red = MHC IIb, and negative = MHC IIx); scale bar represents 100 µm. All individual data points are presented as mean ± SEM. A two-way ANOVA was used. A Sidak’s multiple comparisons test was used when an interaction was detected. Panels (A–H) contain n = 3–10.

