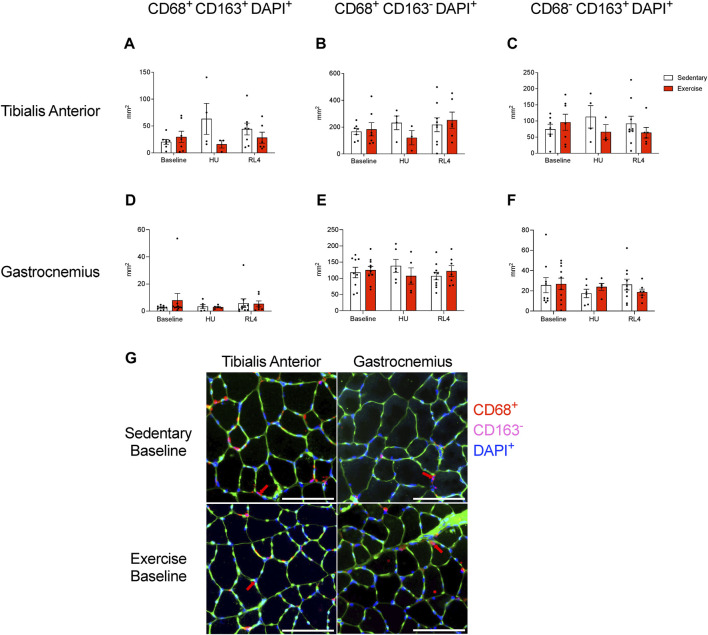
FIGURE 6.
Macrophage immunofluorescence quantification was examined within the (A–C) tibialis anterior and the (D–F) gastrocnemius cross-sectional muscles for both sedentary (open bar) and exercise (red bar) groups at baseline, HU, and RL4 time points. The following inflammatory profiles were examined for macrophage abundance: CD68+ CD163+ DAPI+ macrophages, CD68+ CD163− DAPI+ macrophages, and CD68− CD163+ DAPI+ macrophages. (G) Representative immunofluorescent cross-sectional images of the TA and gastrocnemius muscles for both baseline sedentary and exercise groups (green = wheat germ agglutinin (WGA), blue = DAPI, red = CD68, and magenta = CD163 (low abundance); red arrows indicate cells that were positive for DAPI and CD68 but negative for CD163; scale bar represents 100 µm. All individual data points are presented as mean ± SEM. A two-way ANOVA was used. A Sidak’s multiple comparisons test was used when an interaction was detected. Panels A–F contain n = 3–10.

