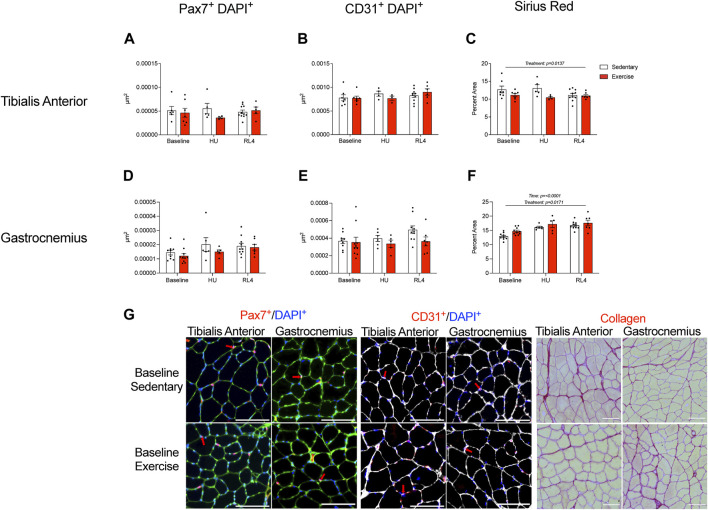
FIGURE 7.
Satellite cells, capillary content, and muscle fibrosis/collagen were measured in the tibialis anterior (A–C) and gastrocnemius (D–F) cross-sections at baseline, HU, and RL4. Satellite cell immunofluorescence quantification was accessed by the overlay of Pax7+ and DAPI+ cells. Capillary content was determined from muscle cross-sections using the overlay of CD31+ and DAPI+ cells. The percentage of Picrosirius Red was used to determine muscle fibrosis in muscle cross-sections. (G) Representative immunofluorescent images of the quantified satellite cells, CD31+ cells, and collagen content (Picrosirius Red) found within the TA and gastrocnemius for baseline sedentary and exercise groups. The scale bar represents 100 µm. Colors represent the following: satellite cells: green = laminin, blue = DAPI, and red = Pax7; red arrows indicate positive DAPI and Pax7 cells. Capillary content: white = laminin, blue = DAPI, and red = CD31; red arrows denote positive DAPI and CD31 cells. Sirius Red: red = collagen and yellow = muscle. All individual data points are presented as mean ± SEM. A two-way ANOVA was used. A Sidak’s multiple comparisons test was used when an interaction was detected. Panels A–F contain n = 3–11.

