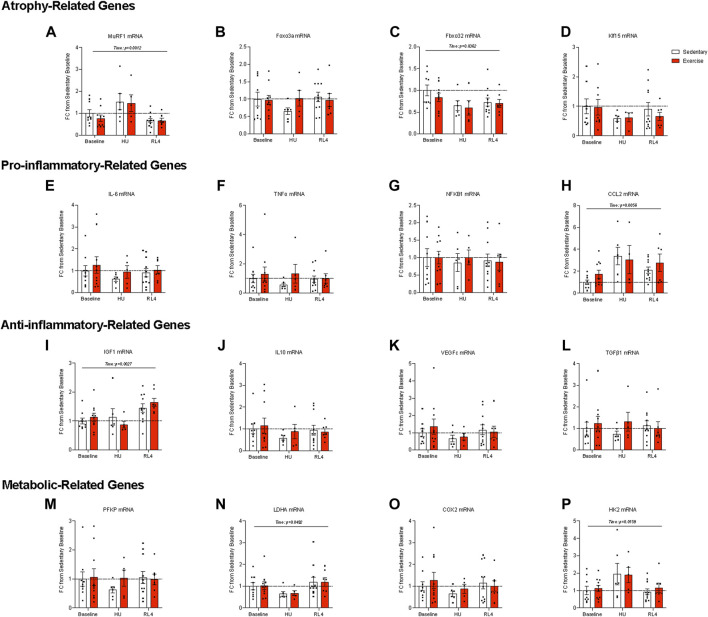
FIGURE 8.
Gene expression of the gastrocnemius muscle at baseline, HU, and RL4. The following atrophy-related genes were accessed: (A) MuRF1, (B) Foxo3a, (C) Fbxo32, and (D) Klf15. Pro-inflammatory-related genes (E) IL-6, (F) TNF-α, (G) NF-κB1, and (H) CCL2 were examined. The following anti-inflammatory-related genes were evaluated: (I) IGF-1, (J) IL-10, (K) VEGFc, and (L) TGF-β1. Metabolism-related genes accessed are as follows: (M) PFKP, (N) LDHA, (O) COX2, and (P) HK2. All individual data points are presented as mean ± SEM. A two-way ANOVA was used. A Sidak’s multiple comparisons test was used when an interaction was detected. Panels A–F contain n = 4–11.

