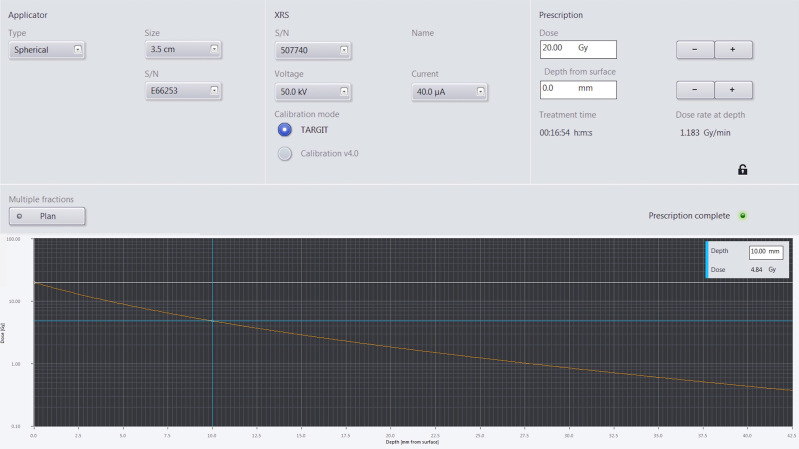
Figure 1.
The upper panel of the figure shows the plan parameters used. The left most panel shows the applicator specific information such as applicator size and serial number, the middle panel shows the treatment beam parameters such as beam energy, beam current, and that the calibration mode used, the right most panel shows the prescription dose and at what distance from the applicator surface that dose is prescribed to along with the treatment time and dose rate at depth to deliver the prescribed dose. The bottom panel shows a semi-log plot of the dose versus distance from the applicator surface. The blue cross shows that the dose 10 mm away from the applicator deceases to 4.84 Gy for a prescription dose of 20 Gy at the applicator surface.

