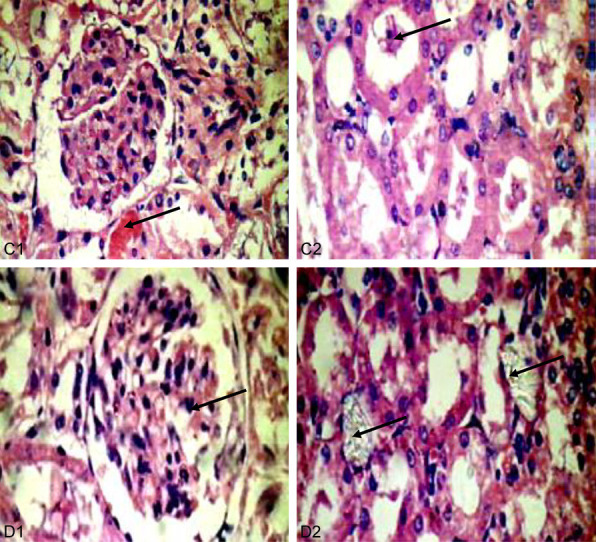
Figure 7.

Kidneys of CS treated groups (C: 200 mg/kg, D: 400 mg/kg). C1: Little intratubular bleeding and hemorrhage (40 × 400). C2: No crystals but with intratubular casts in renal tubules (40 × 400). D1: Kidney with multi lobulated glomerulus (40 × 400). D2: CS less crystals, and less intratubuler casts in renal tubules (40 × 400).
