. 2023 Sep 19;11(22):7346–7357. doi: 10.1039/d3bm00873h

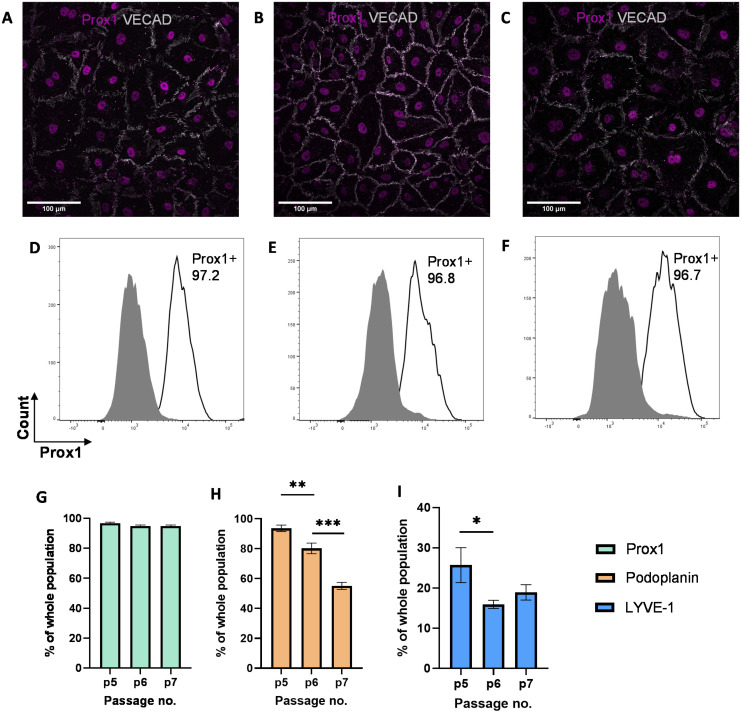
Fig. 2. Expression of lymphatic markers by LECs cultured on tissue culture plates. Representative immunofluorescent images of LECs cultured on tissue culture plates at (A) P.5, (B) P.6, and (C) P.7 stained for VE-CAD (white) and Prox-1 (magenta). Scale bars are 100 μm. LECs cultured on tissue culture plates were analyzed for Prox-1 using flow cytometry. Representative flow cytometry analysis indicating Prox-1 expression by LECs (white histogram) at (D) P.5, (E) P.6, and (F) P.7 compared to isotype control (grey histogram). Flow cytometry data for LECs at P.5, P.6, and P.7 were analysed for percentage of (G) Prox1+, (H) podoplanin+, and (I) LYVE-1+ cells population. Data represents mean ± stdev., n = 4 per condition. Significance levels were set at: *P < 0.5, **P < 0.01, and ***P < 0.001.

Fig. 2